Supervision#
The supervision mechanism enables data quality management when working with external data sources. As an analyst, you can correct erroneous values while the system maintains the original data and ensures that provider corrections automatically flow through.
The supervision workflow#
Consider a typical scenario: you receive daily market data from a provider. Sometimes this data contains errors that need immediate correction for your reports. The supervision system allows you to:
Apply manual corrections to fix errors immediately
Continue receiving updates from the provider
Have provider corrections automatically replace your manual fixes
Maintain full audit trail of all changes
Making manual corrections#
Manual corrections can be applied in three ways:
>>> corrected_values = pd.Series([95.5, 96.0],
...                              index=[pd.Timestamp('2023-03-15'),
...                                     pd.Timestamp('2023-03-16')])
>>> tsa.update('market-prices', corrected_values, 'analyst@corp.com', manual=True)
The same manual corrections can be made through the web interface or the Excel client - both automatically use manual=True when you edit values.
Your corrections appear immediately in the data. When the provider later sends corrected data through the normal update process, their fixes automatically replace your manual corrections.
Viewing data provenance#
The .edited method shows you which values are original versus manually edited:
>>> series, markers = tsa.edited('market-prices')
The returned series contains the current values, while markers is True where data was manually edited and False for provider data.
To retrieve the raw series — the automated feed before any manual
correction — pass upstream=True to get:
>>> raw = tsa.get('market-prices', upstream=True)
This returns the data as the source delivered it, ignoring every manual edit.
Understanding supervision status#
Every series has a supervision status in its metadata:
unsupervised: series updated only through normal updates (never with manual=True)handcrafted: series created and maintained entirely with manual updates (always with manual=True, whether from Python, Excel client, or web UI)supervised: series containing both provider updates and manual corrections
This helps you quickly identify which series have manual interventions.
The web editor#
The Series Editor is the web interface for visualising and editing time series directly in the browser, accessible from the series catalog.
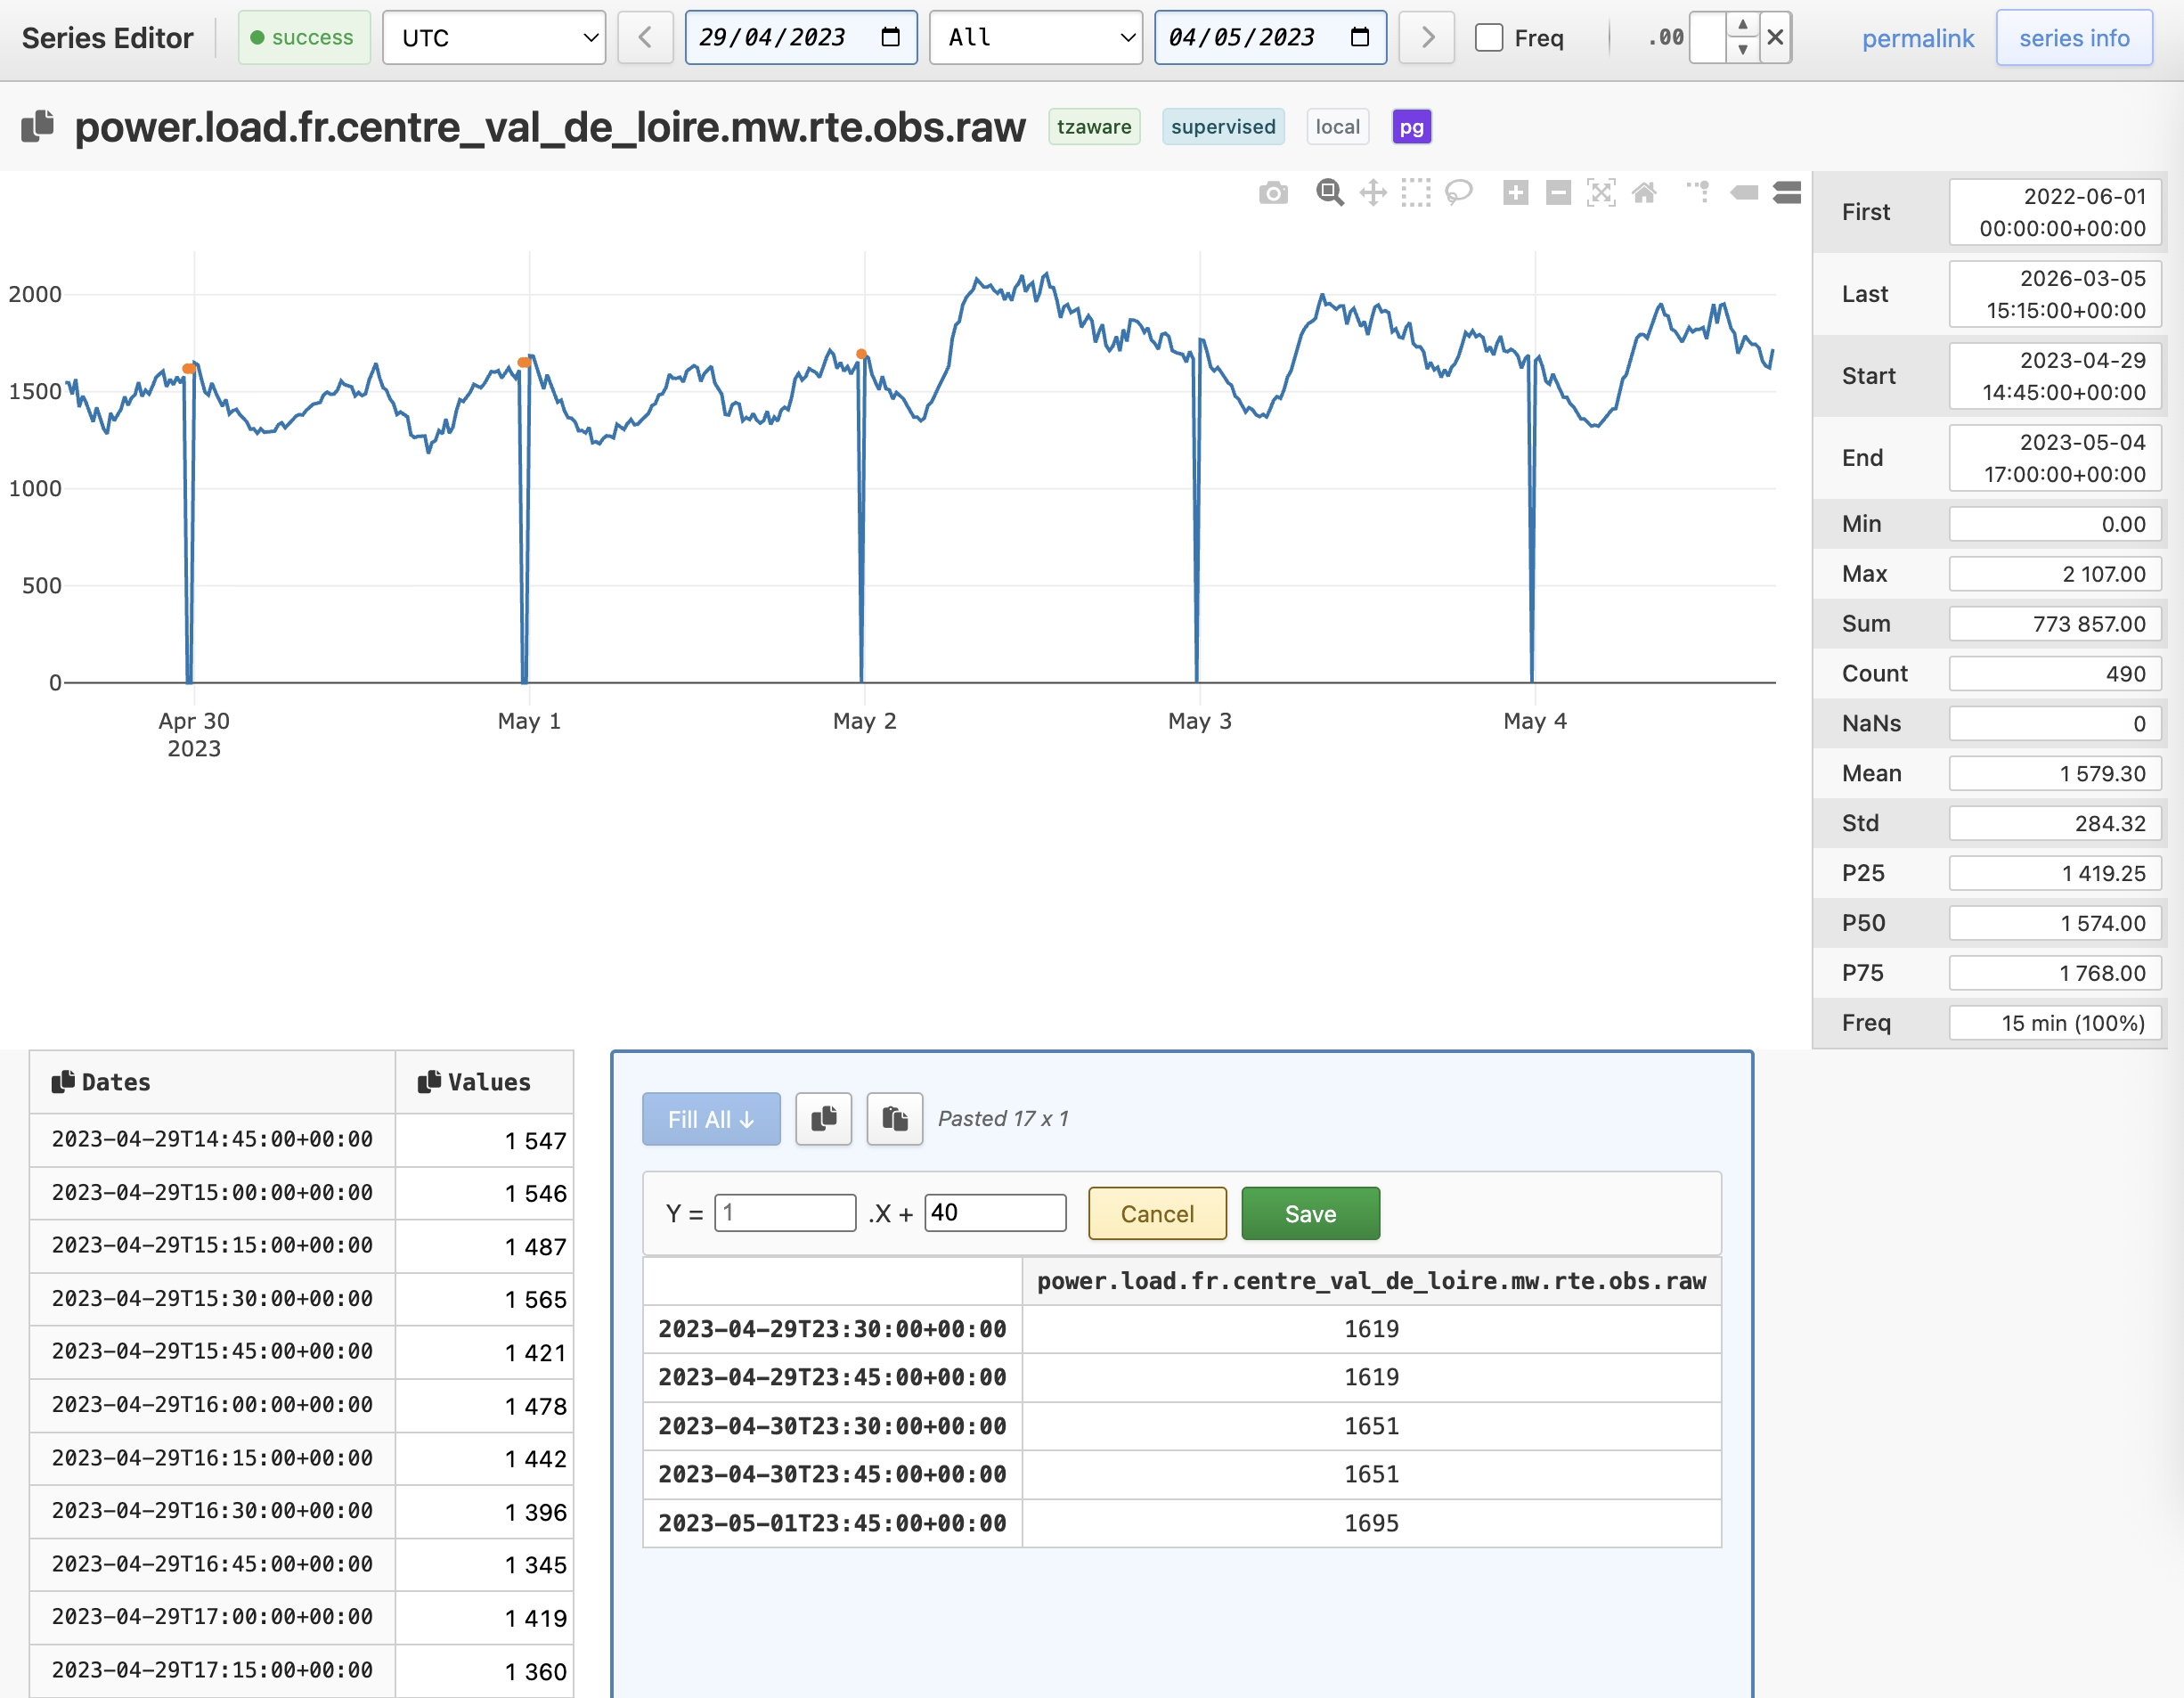
The editor is organised into three areas:
Graph (top): displays the series values over the selected time window, with Plotly controls for zoom, pan and reset. When edits are pending, modified values appear in orange alongside the originals. Overrides are also marked visually.
Data table (bottom left): shows date-value pairs for the visible window.
Statistics panel (right): shows real-time descriptive statistics for the visible window — First/Last insertion dates, Start/End value dates, Min, Max, Sum, Count, NaN count, Mean, Std, P25, P50, P75, and inferred frequency.
The top bar controls the time window (from/to dates), the timezone, decimal precision, and provides a permalink and a series info link.
Selecting and navigating#
A click selects a row and sets it as the anchor for subsequent keyboard or shift-click extensions. Shift+click extends the selection from the anchor to the clicked row. Click-and-drag selects all rows crossed. Escape deselects everything.
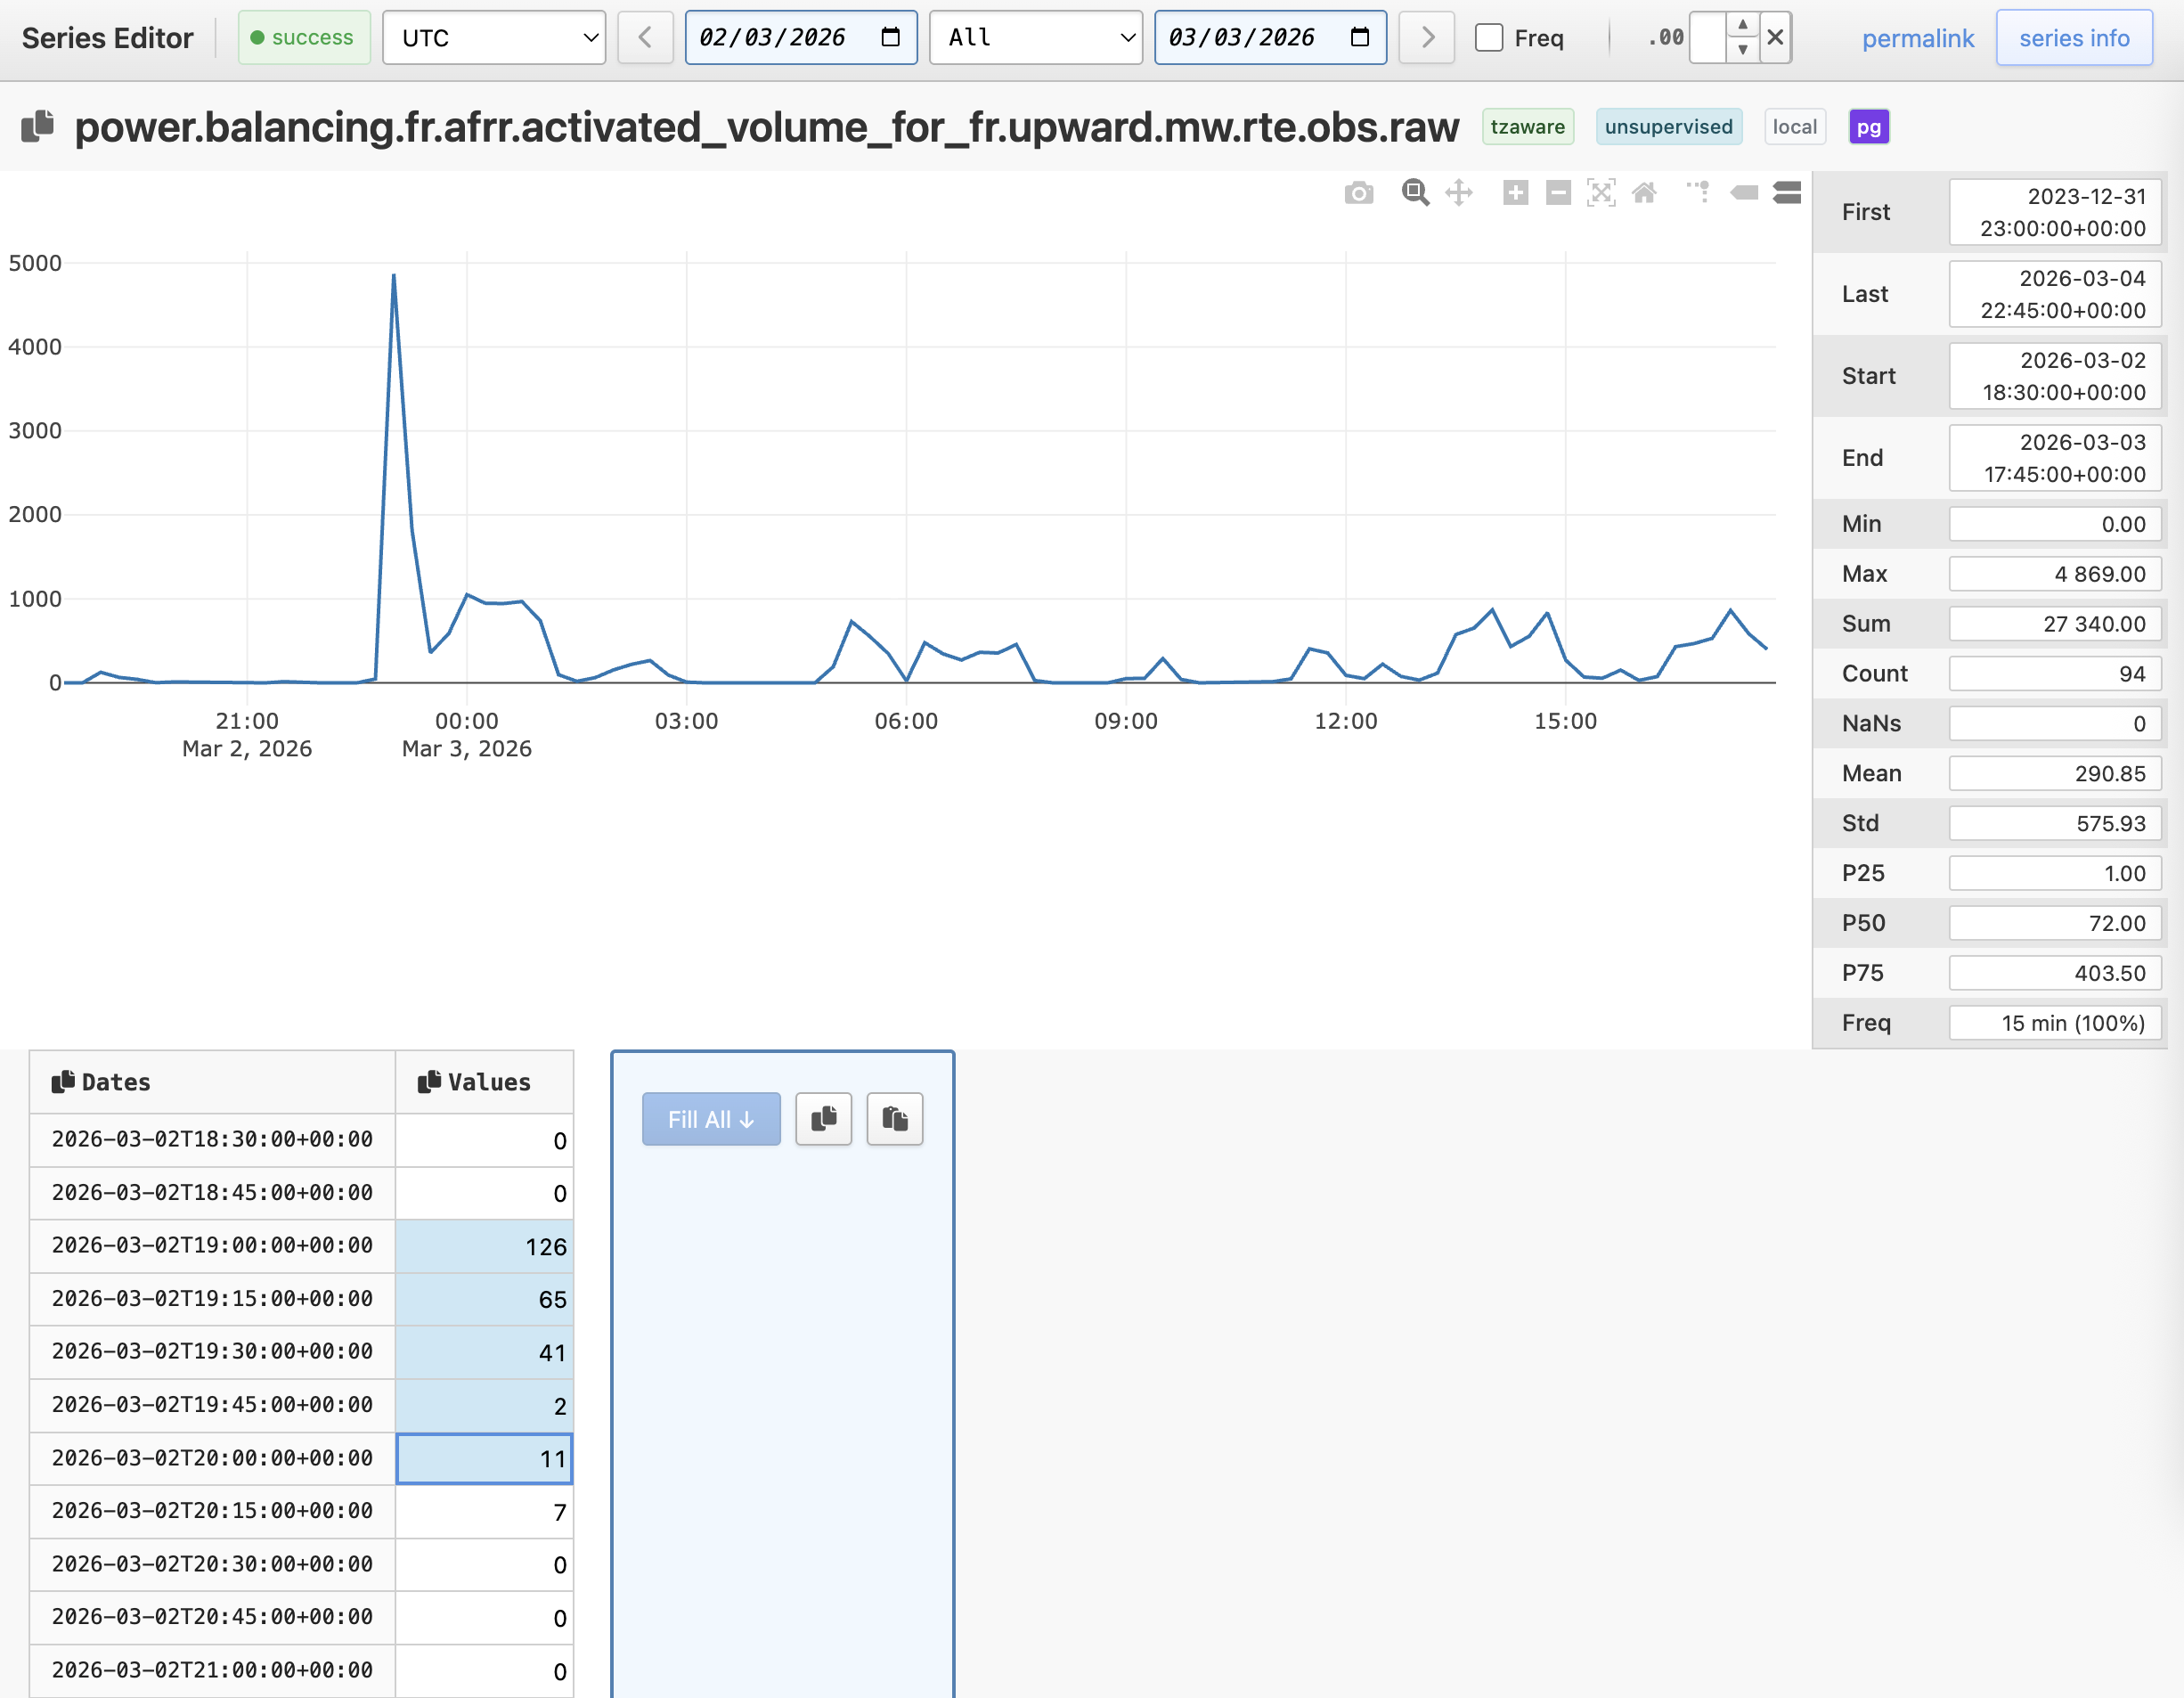
Keyboard navigation:
Up/Down arrows: move focus one row
Shift+Up/Down: extend the selection
Ctrl+Up/Down: jump to the start or end of the series
PageUp/PageDown: scroll one screen
Editing values#
Direct editing: clicking on a value cell makes it editable. The original value remains visible, and the change can be cancelled before saving.
Copy and paste: data copied from Excel or any spreadsheet can be pasted directly. The editor parses the content to extract date-value pairs, handling multiple date formats, and matches them to existing timestamps. The current selection can also be copied to the clipboard in TSV format for use in a spreadsheet.
Filling missing values: the Fill NAs button identifies each contiguous group of missing values and fills them by linear interpolation between the last valid point before the gap and the first valid point after it. Fill All processes all visible gaps at once.
Linear correction: an affine transformation can be applied to the selected
values. The user enters a slope and an intercept; each selected value is
transformed as y' = slope × y + intercept. This is typically used to
correct a sensor offset or an incorrect scale factor.
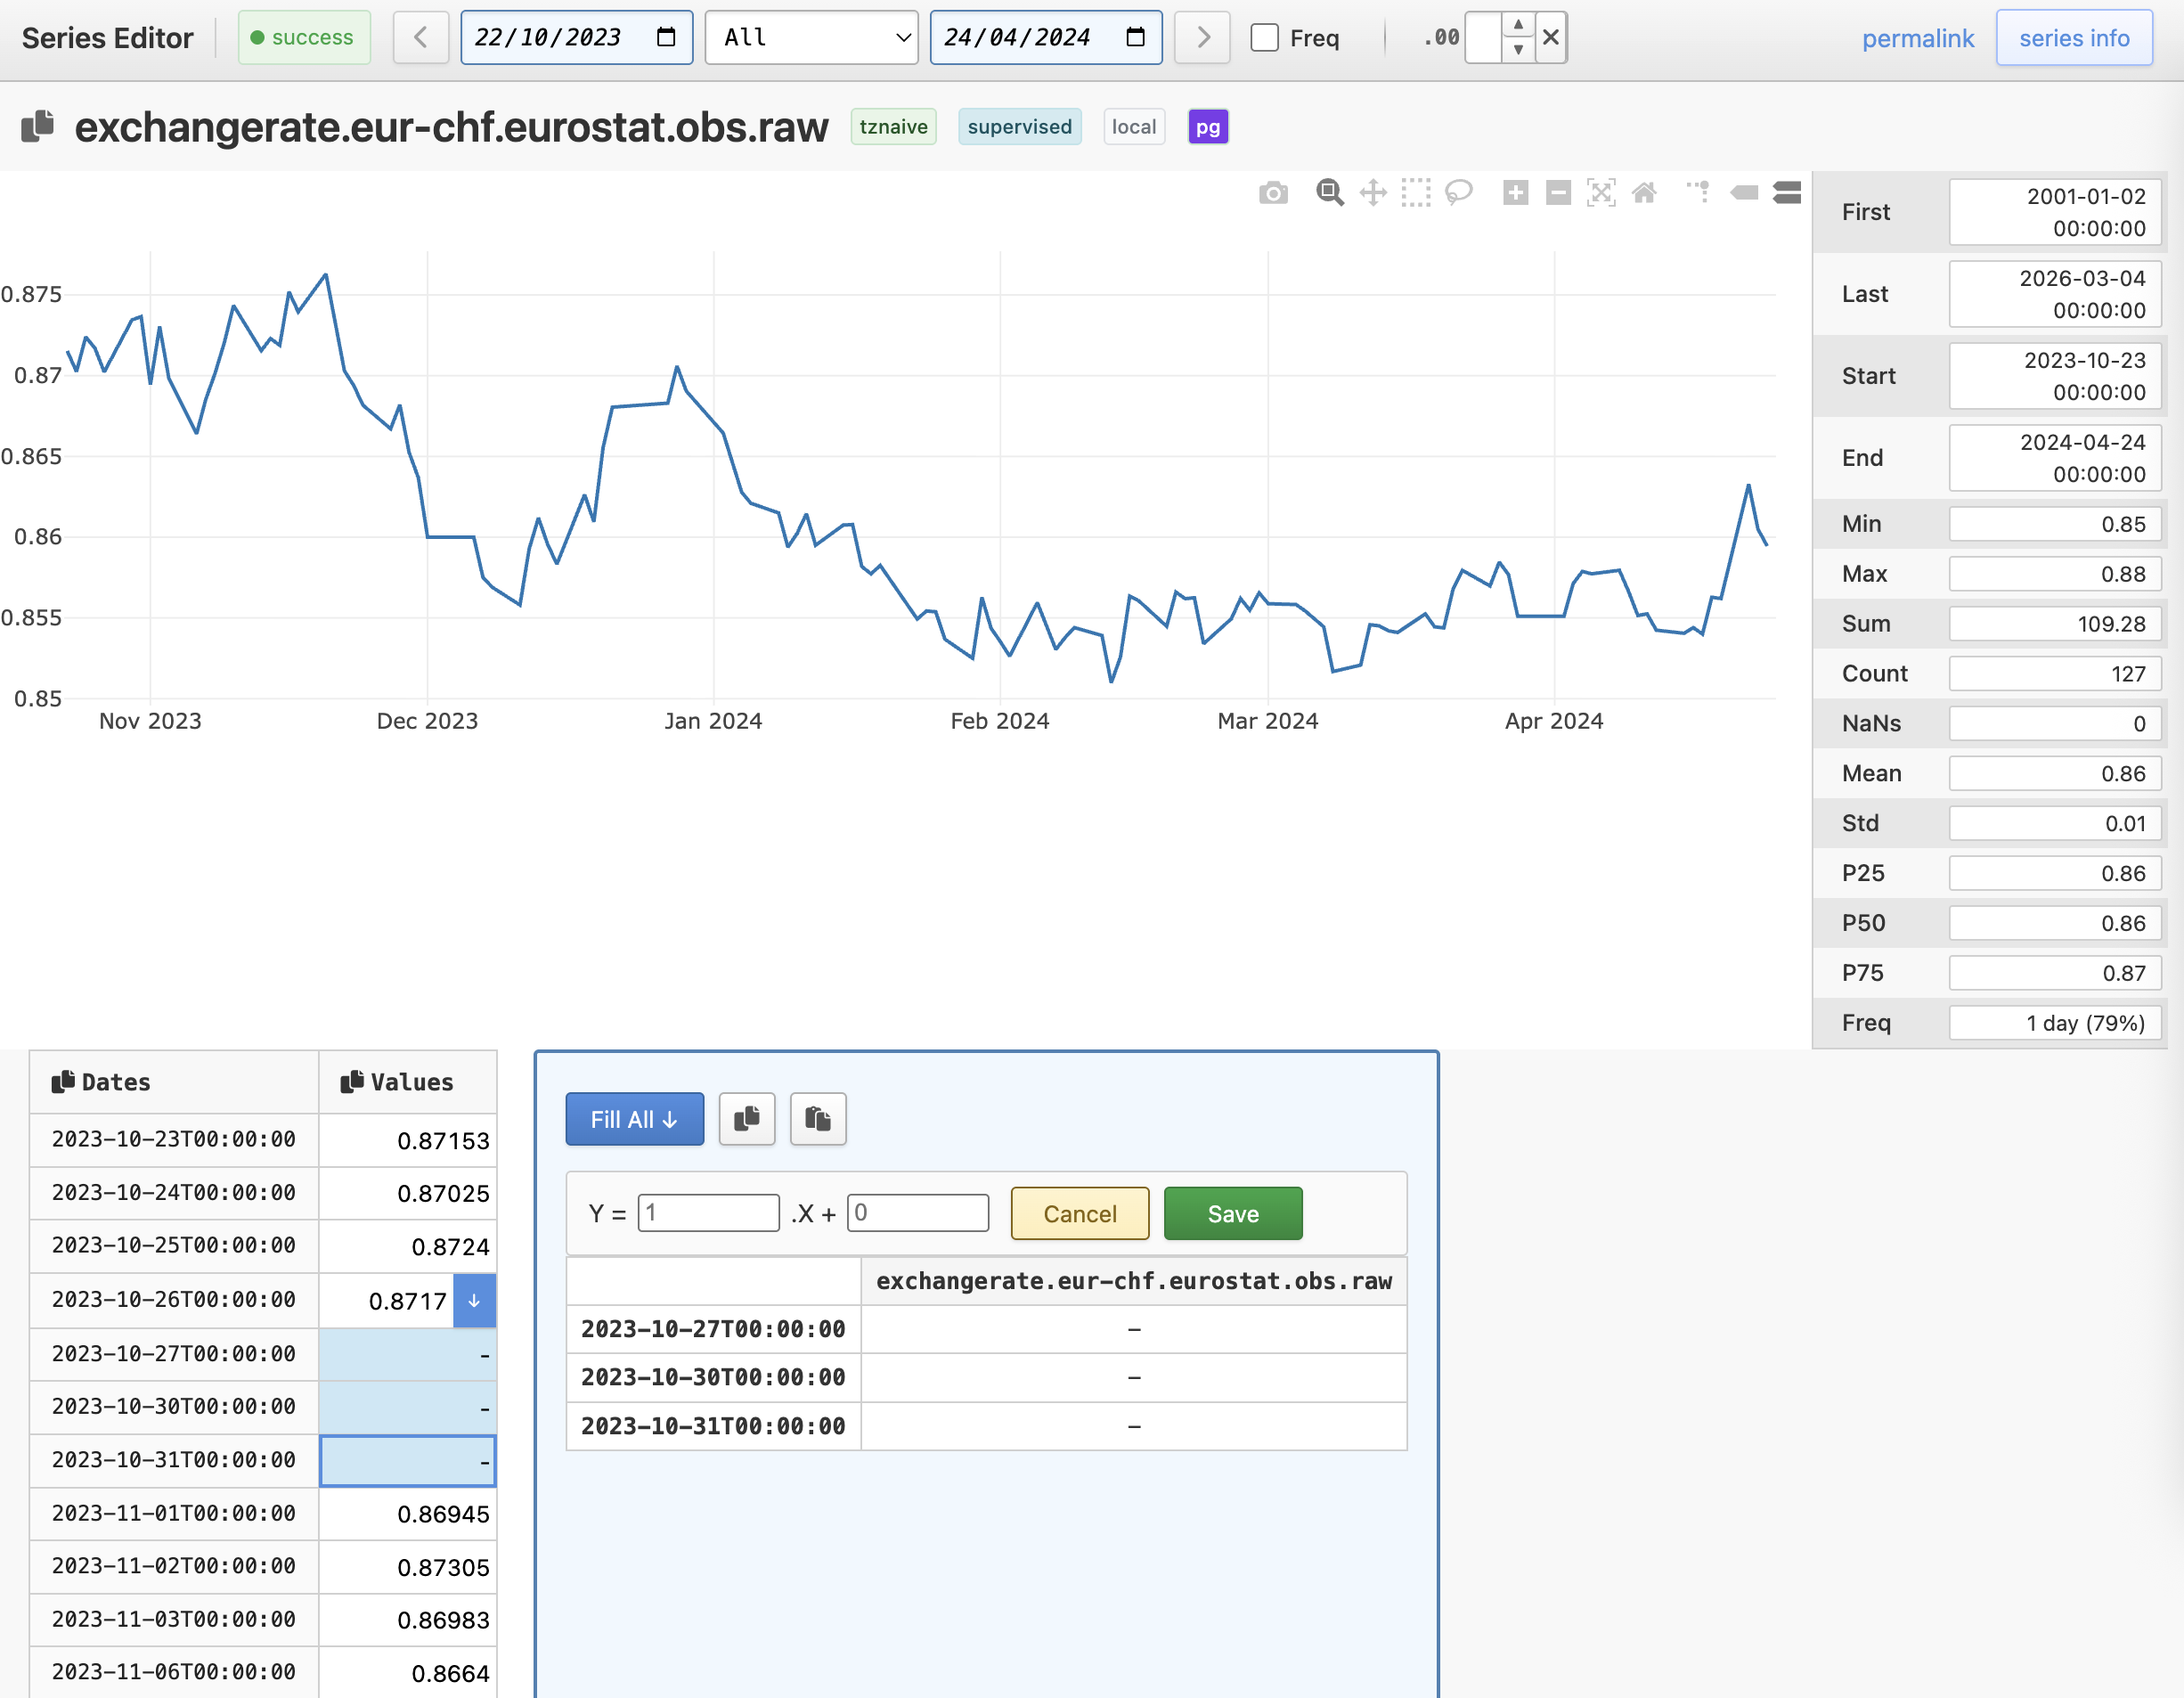
Batch deletion: pressing the Delete key removes the values from all selected cells in one operation, turning them into missing values.
Editing several series at once#
The editor is a spreadsheet that can hold several series side by side, each as a column aligned on a shared date axis. Only primary series are editable; formula series are read-only.
Its main use is correcting a formula at its source. Open the formula in the editor from its tsinfo page with the show values link. A formula is computed and cannot be edited directly, but the Expand Formula button reveals the primary source series it is built from, each as an editable column — so you can correct the underlying data with the formula’s own values in view, all in the same table.
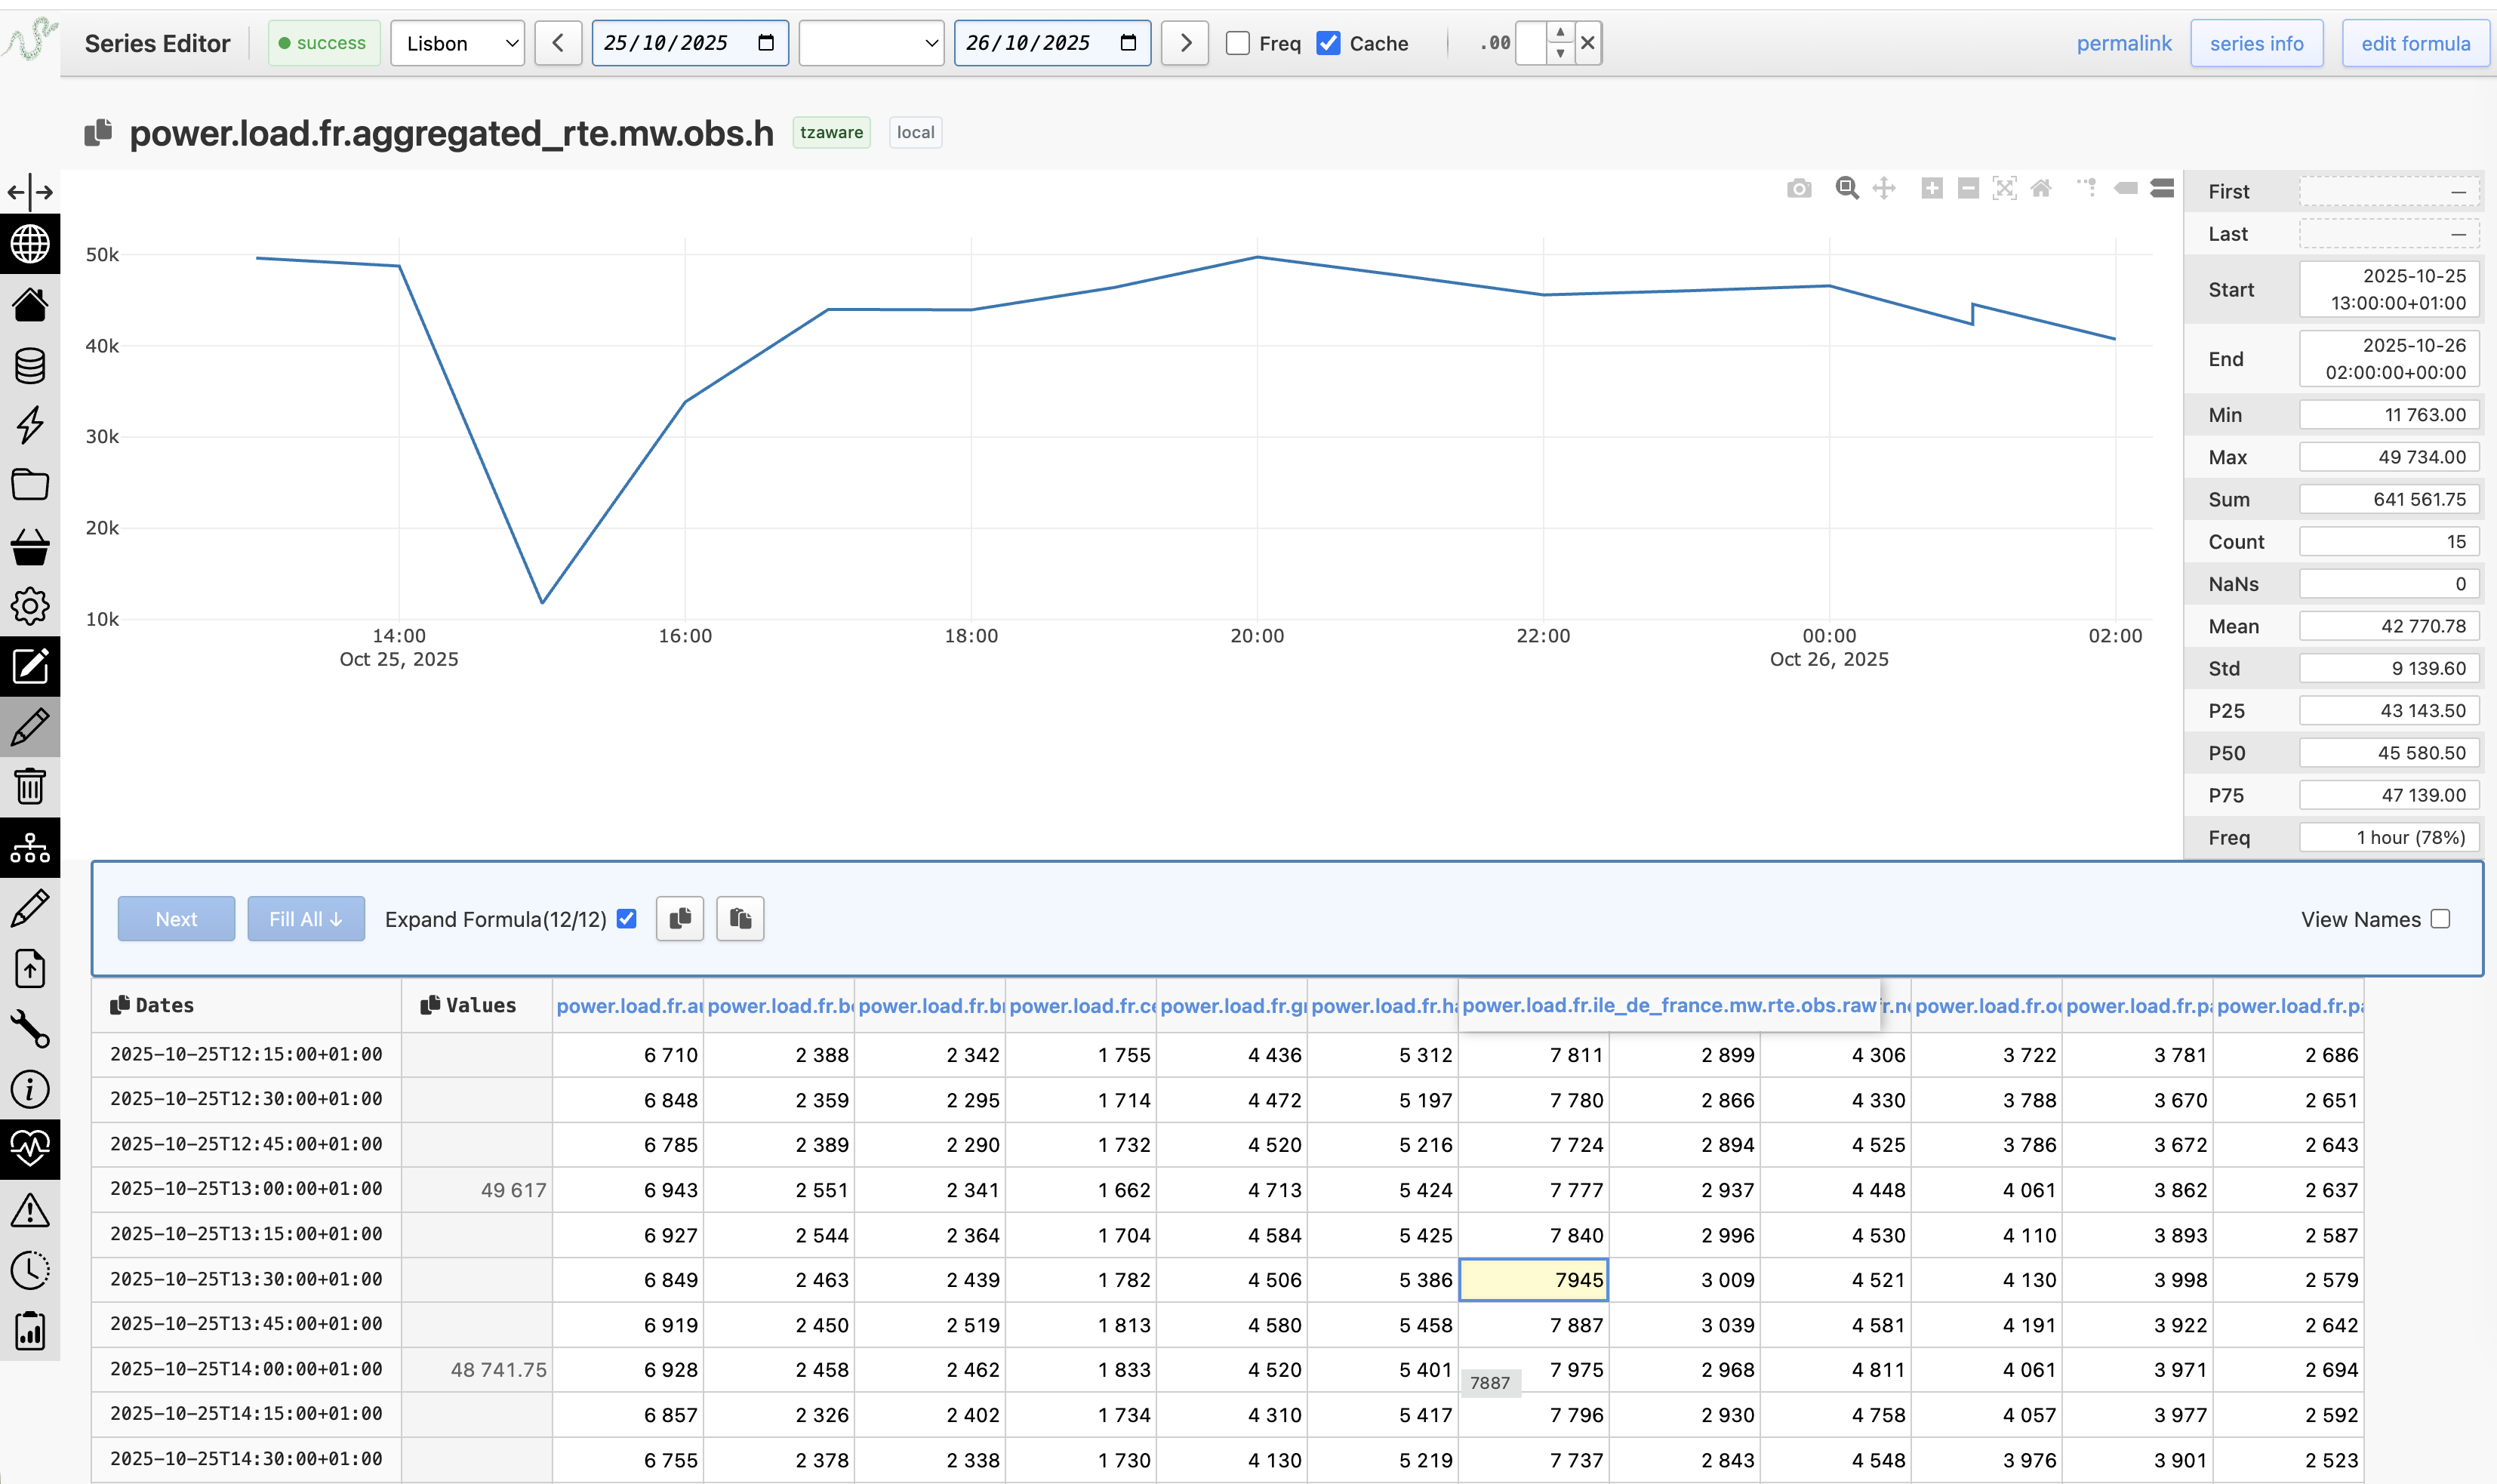
Several series can also be loaded into the editor from three other places:
A folder (see Folders) — its Edition link opens every series it contains.
A basket — its View link opens its series in Quick view, from where they can be sent to the editor.
Quick View — a page that displays a set of series, with an Edition button that opens them all in the editor.
With several columns, the tools above become two-dimensional:
Rectangular selection — the selection can span several series (columns) as well as several dates (rows). Shift+click, click-and-drag and Shift+arrow extend the rectangle across columns; clicking a column header selects a whole series.
2D copy and paste — the selected block is copied as a tab-separated grid (columns = series), so it drops straight into a spreadsheet; conversely a multi-column block copied from a spreadsheet is pasted back as a rectangle anchored at the focused cell, writing only into editable cells.
Batch operations across series — Delete, Fill All and the linear correction apply to every selected or edited cell, whatever series it belongs to.
Saving — a single save commits the pending edits to every series that was modified.
Decimal formatting#
The number of decimal places displayed can be adjusted with the +/- buttons in the top bar. Thousands are separated by spaces. These preferences are retained between sessions.
Supervision API Reference#
- class mainsource(*args, **kwargs)
API façade for the main source (talks directly to the storage)
The api documentation is carried by this object. The http client provides exactly the same methods.
- edited(name, revision_date=None, from_value_date=None, to_value_date=None, inferred_freq=False, keepnans=False)
Returns the base series and a second boolean series whose entries indicate if an override has been made or not.
- Parameters:
name (str)
revision_date (Timestamp | None)
from_value_date (Timestamp | None)
to_value_date (Timestamp | None)
inferred_freq (bool | None)
keepnans (bool)
- Return type:
Tuple[Series, Series]
- supervision_status(name)
Returns the supervision status of a series. Possible values are unsupervised, handcrafted and supervised.
- Parameters:
name (str)
- Return type:
str