Time Series Monitoring#
Tswatch is a monitoring and alerting system for time series data that helps you track the health and update frequency of your most important time series. It provides a web-based tool to monitor data freshness and identify potential issues with data pipelines.
Note
This is an essential feature of the Timeseries Refinery. It is only accessible within the pro version. If interested, please visit: https://timeseries.pythonian.fr/#ouroffer.
Overview#
Tswatch continuously monitors your critical time series and provides:
Real-time status monitoring of time series update frequency
Priority-based alerting with color-coded status indicators
Dependency tracking for formula series
Investigation tools to trace data pipeline issues
Configurable monitoring namespaces for organizing series
The system automatically calculates expected update frequencies based on historical patterns and alerts you when series deviate from their normal update schedule.
Adding Series to Monitor#
Search for series: Use the search bar to find series by keywords separated by spaces
Select series: Click on the series you want to monitor
Register changes: Click “Register changes” to save your selections
The system will begin monitoring these series immediately.
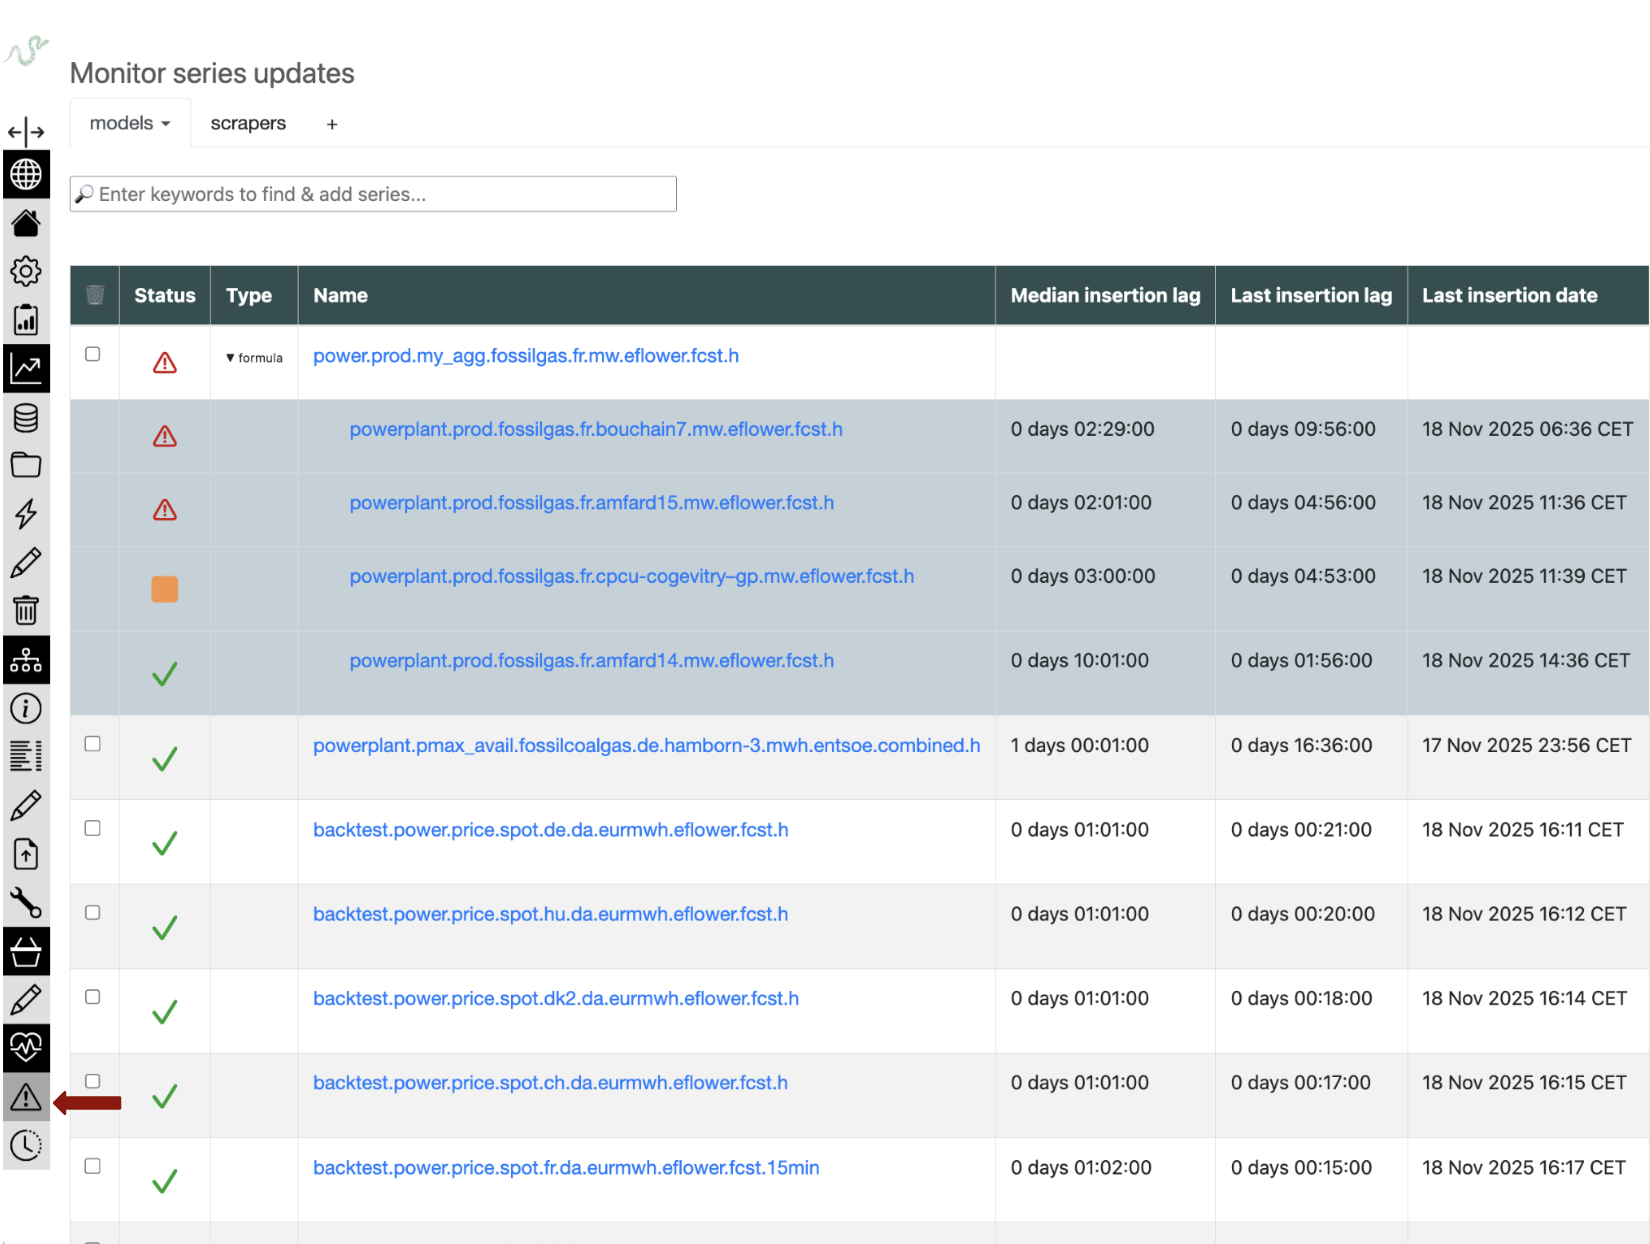
Understanding the Status Dashboard#
The main dashboard displays your monitored series in order of priority, with the most problematic series at the top.
Status Indicators#
Green check ✓: Normal situation - last update conforms to expected frequency
Orange square ■: Small deviation observed - should be monitored
Red alert ⚠: Important deviation - requires immediate attention
Black cross ✖: Ghost series - either doesn’t exist or hasn’t been updated in 2+ months
The status calculation considers:
Historical update patterns
Expected update frequency
Time since last update
Deviation from normal schedule
Monitoring Features#
Series Information#
For each monitored series, the dashboard shows:
Series name (clickable link to tsinfo page)
Status indicator with color coding
Last update timestamp
Expected update frequency
Deviation metrics
Formula Dependencies#
For formula series:
The status displayed is the maximum score of all dependencies
Click the ▶ symbol next to “formula” to see individual dependency status
Trace problematic dependencies to identify root causes
Namespaces and Organization#
Tswatch supports organizing series into namespaces:
Manual namespaces: User-defined groups of series
Basket namespaces: Automatically synchronized with series baskets
Mixed monitoring: Combine different types of series in custom namespaces
Removing Series#
Via web interface: Check the checkbox in the first column and click “Register changes”