Working with series in the browser#
This page covers the same basic operations as Working with series in Python, but from the web interface. Editing the values of an existing series is done in the series editor (see Supervision).
Table of Contents#
Creating a series#
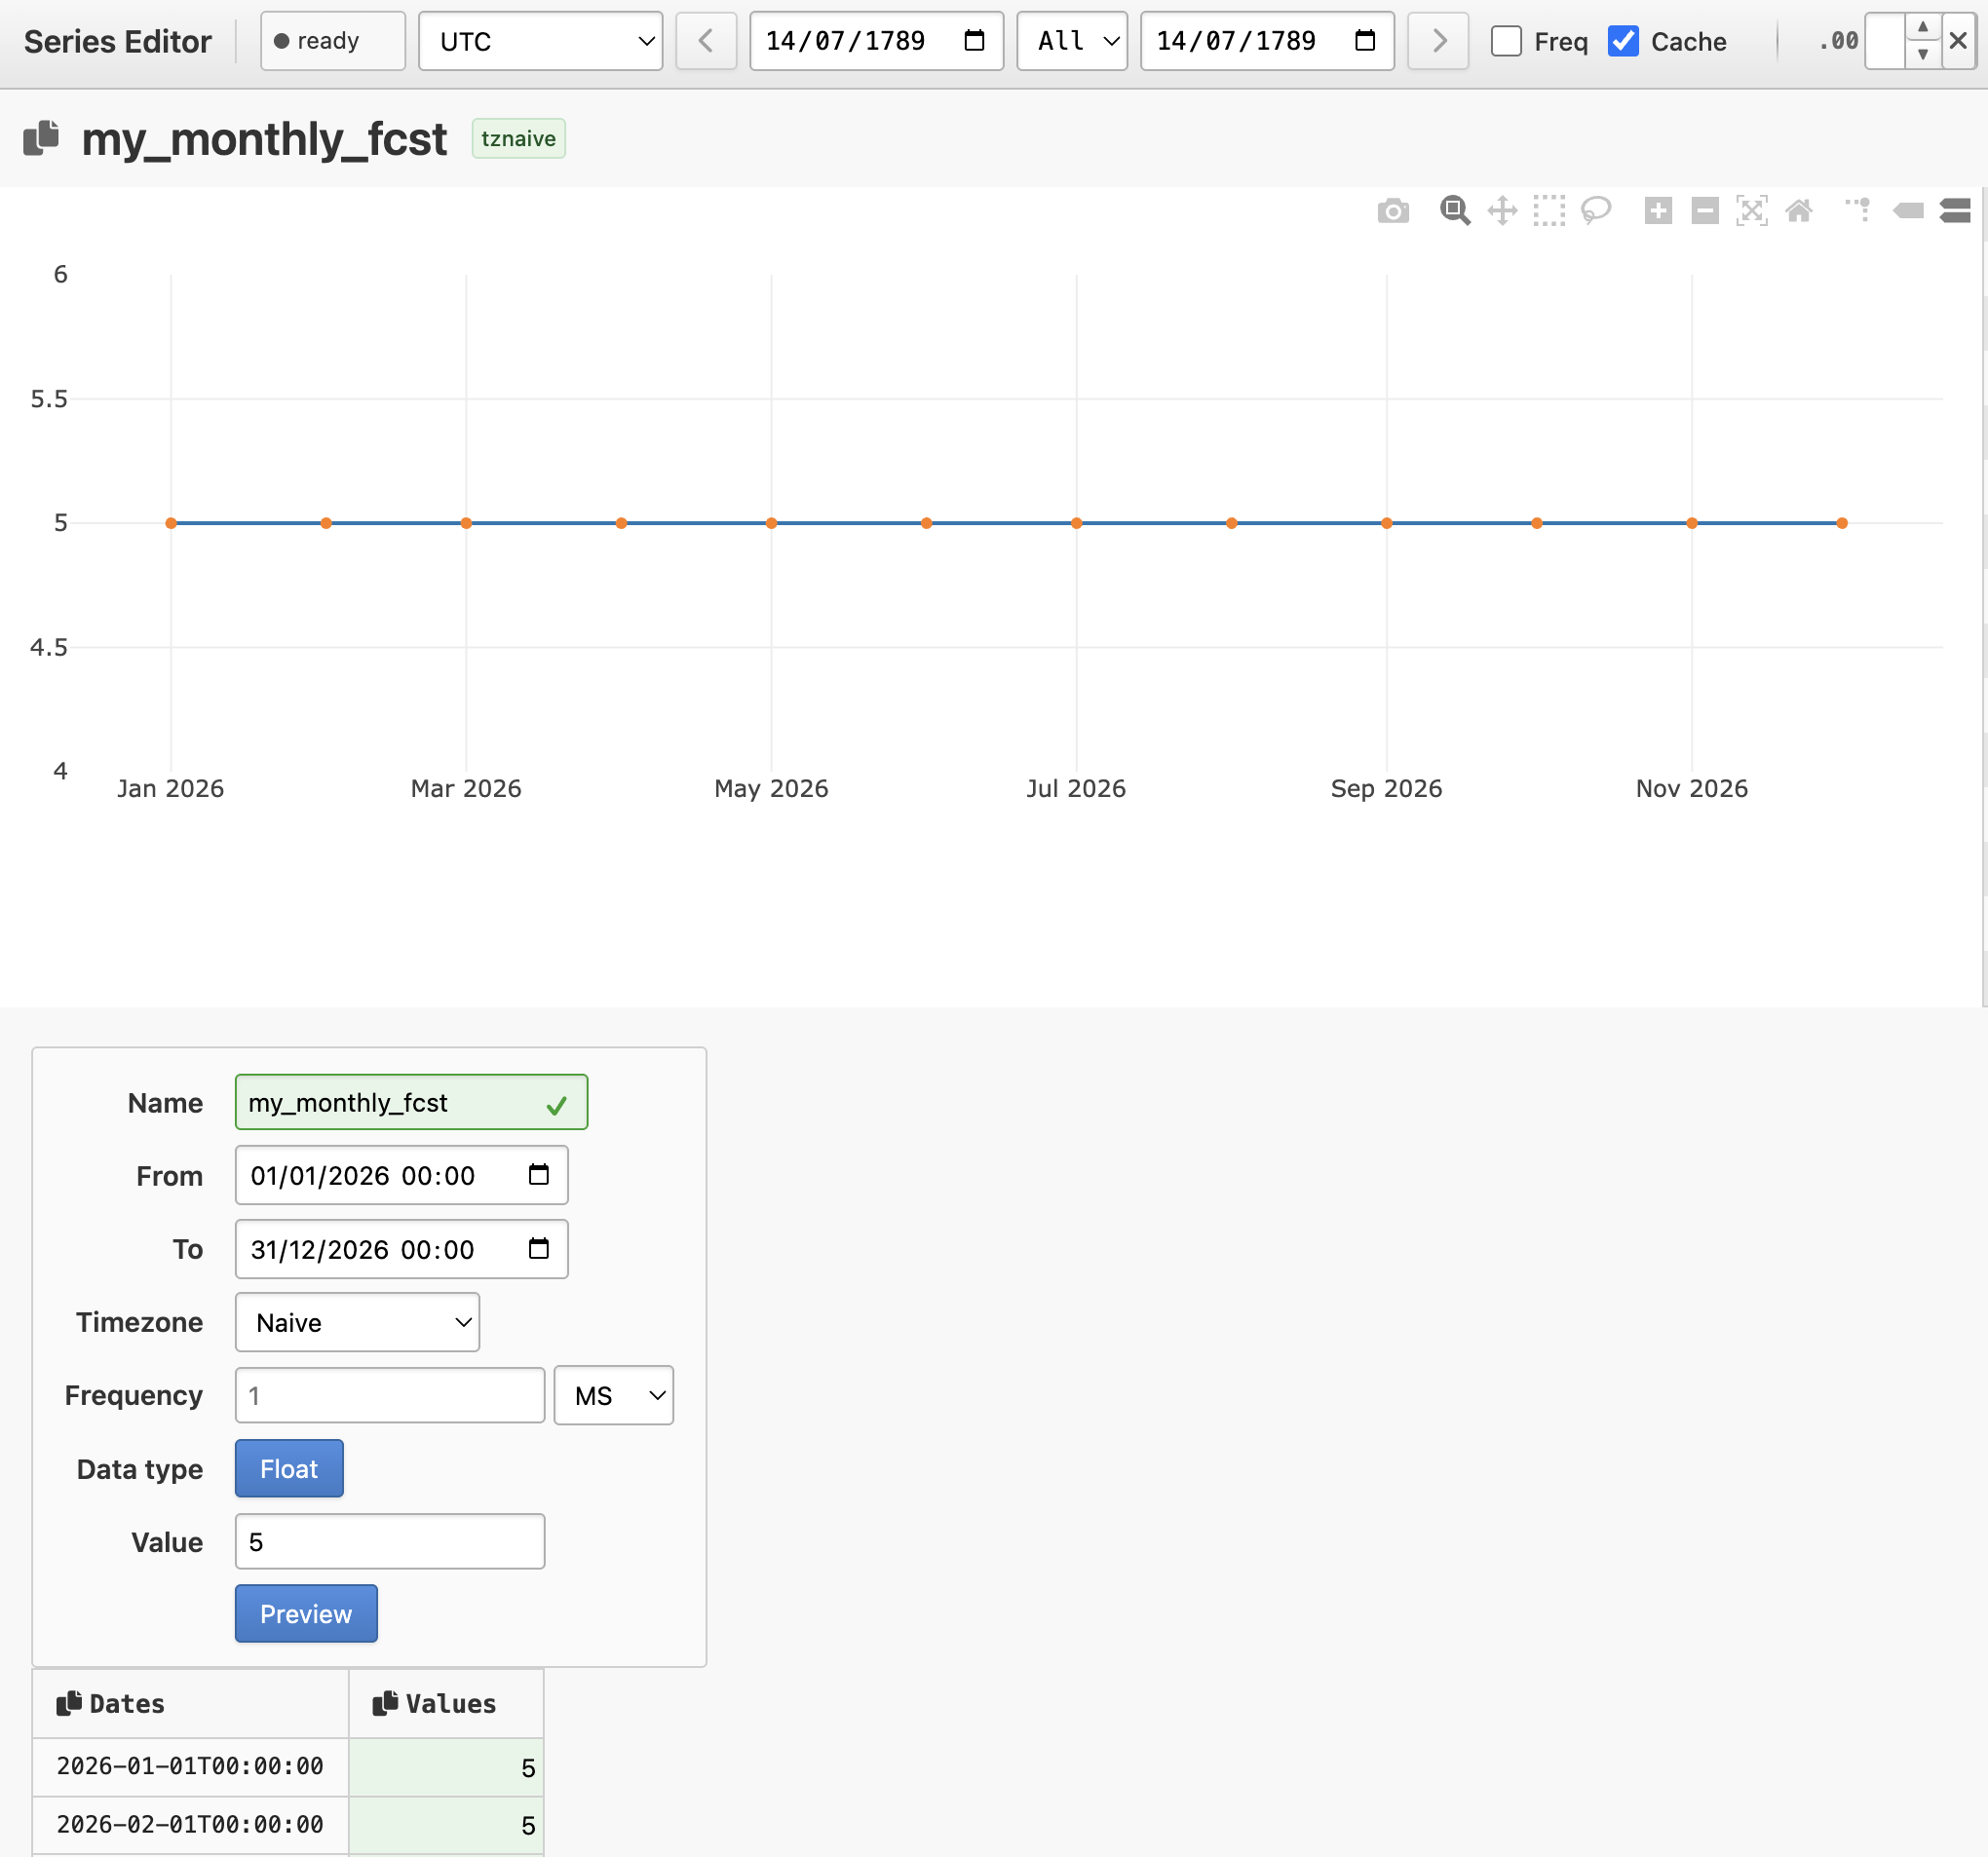
A new series can be created from the Create entry of the left menu, which opens the series editor in creation mode. You fill in:
Name: must be unique (validated in real time)
From / To: initial time bounds
Timezone: chosen from a drop-down list
Frequency: a number and a Pandas alias (
MSfor monthly,Dfor daily,hfor hourly, etc.)Data type: Float or String
Value: optional initial fill value
Clicking Preview generates the timestamp grid and displays a preview in the graph. The series can then be saved.
Importing from a CSV#
Several series can be loaded at once from a CSV file with the
ingest_from_csv task. The CSV holds the dates in its first column and one
series per remaining column, the column header giving the series name:
date,temp.paris,temp.berlin
2026-01-01 00:00,3.2,1.1
2026-01-01 01:00,3.0,0.8
2026-01-01 02:00,2.7,0.5
Each column is applied with update — values are appended or patched, not
replaced — empty cells are skipped, and duplicate dates keep the last row.
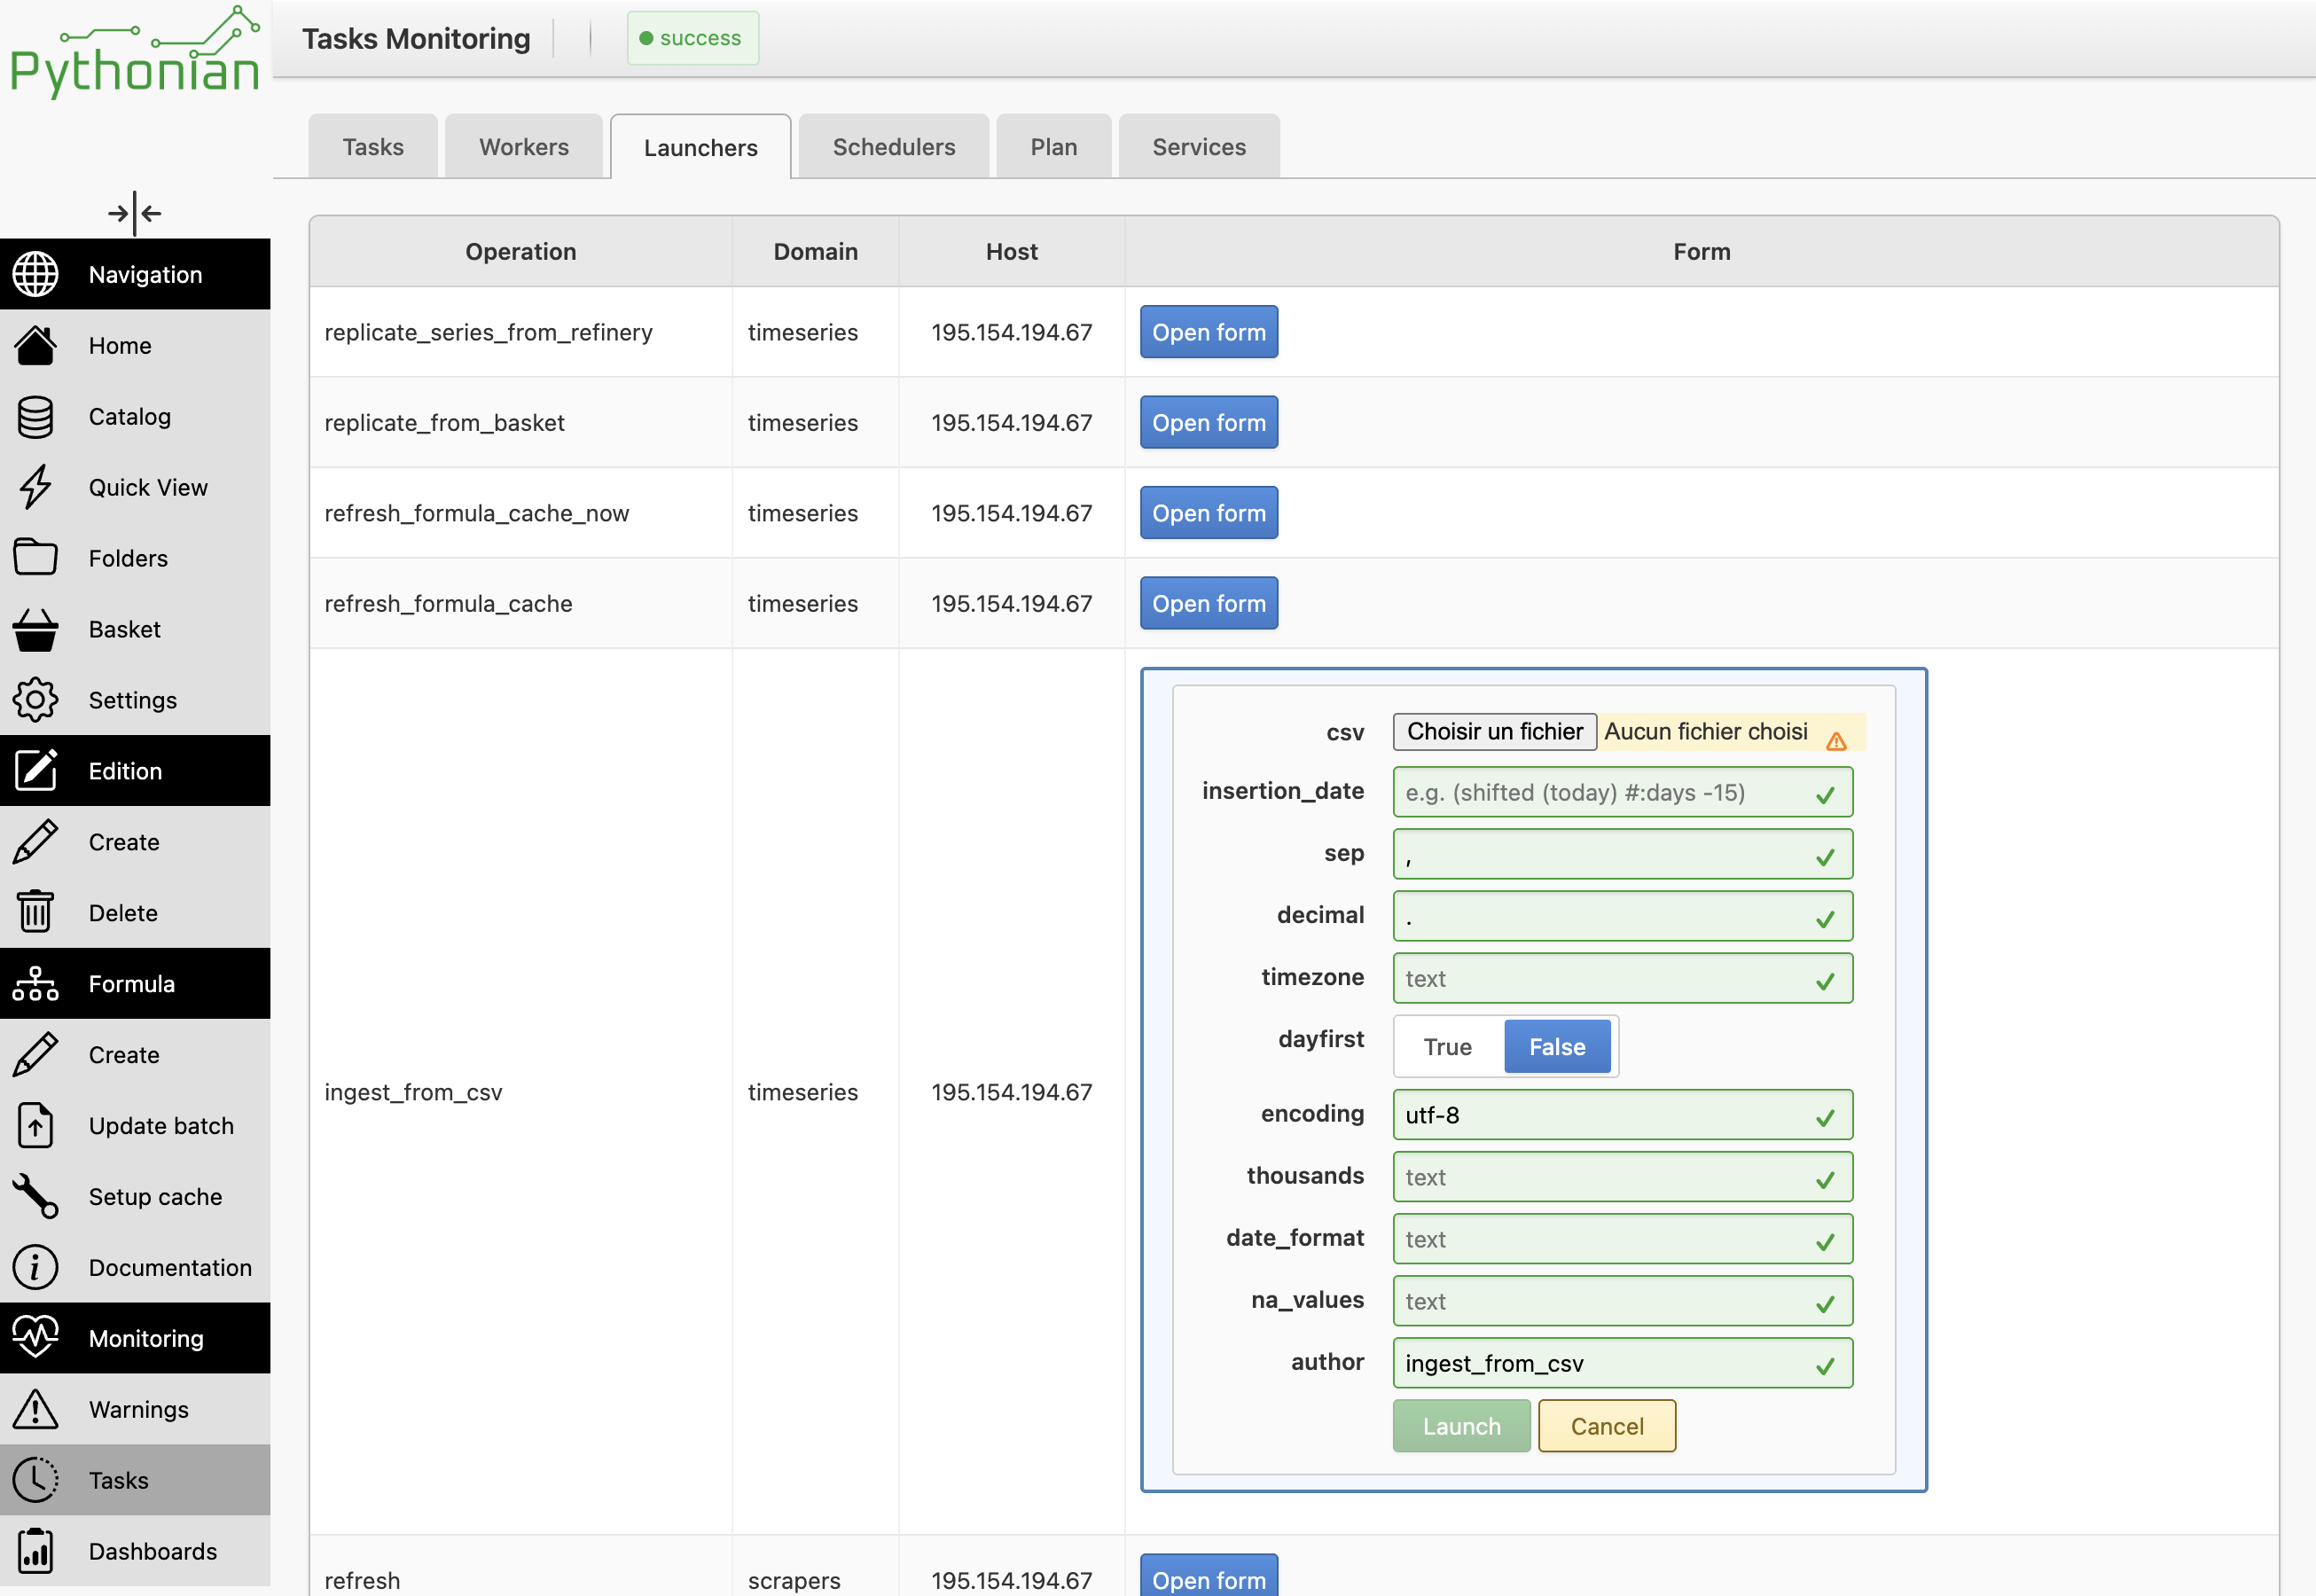
Launch the ingest_from_csv task from the rework task
manager: upload the CSV and set the options. The parsing options are:
sep— column separator (default,).decimal— decimal separator (default.).thousands— thousands separator.encoding— file encoding (defaultutf-8).na_values— extra strings to read as missing values, as a comma-separated list (e.g.NA,N/A,-).dayfirst— parse day-first dates (defaultfalse). It only steers the automatic date-format inference — it has no effect oncedate_formatis set.date_format— an explicit date format, as a Pythonstrptime/strftimeformat string, e.g.%Y-%m-%d %H:%Mfor2026-01-01 14:00,%d/%m/%Yfor01/02/2026, or%m/%d/%Y %I:%M %pfor02/01/2026 02:00 PM. Left empty, the date format is inferred automatically.timezone— attaches or converts the dates to this timezone. If the CSV dates have no offset (naive), they are localized: the clock time is kept as-is and simply tagged with this timezone. If the CSV dates already carry an offset (e.g.+01:00,Z), they are converted: the underlying instant is preserved and the clock time is recomputed for the target timezone.insertion_date— record the update under this insertion date.author— author of the update.
Exploring history#
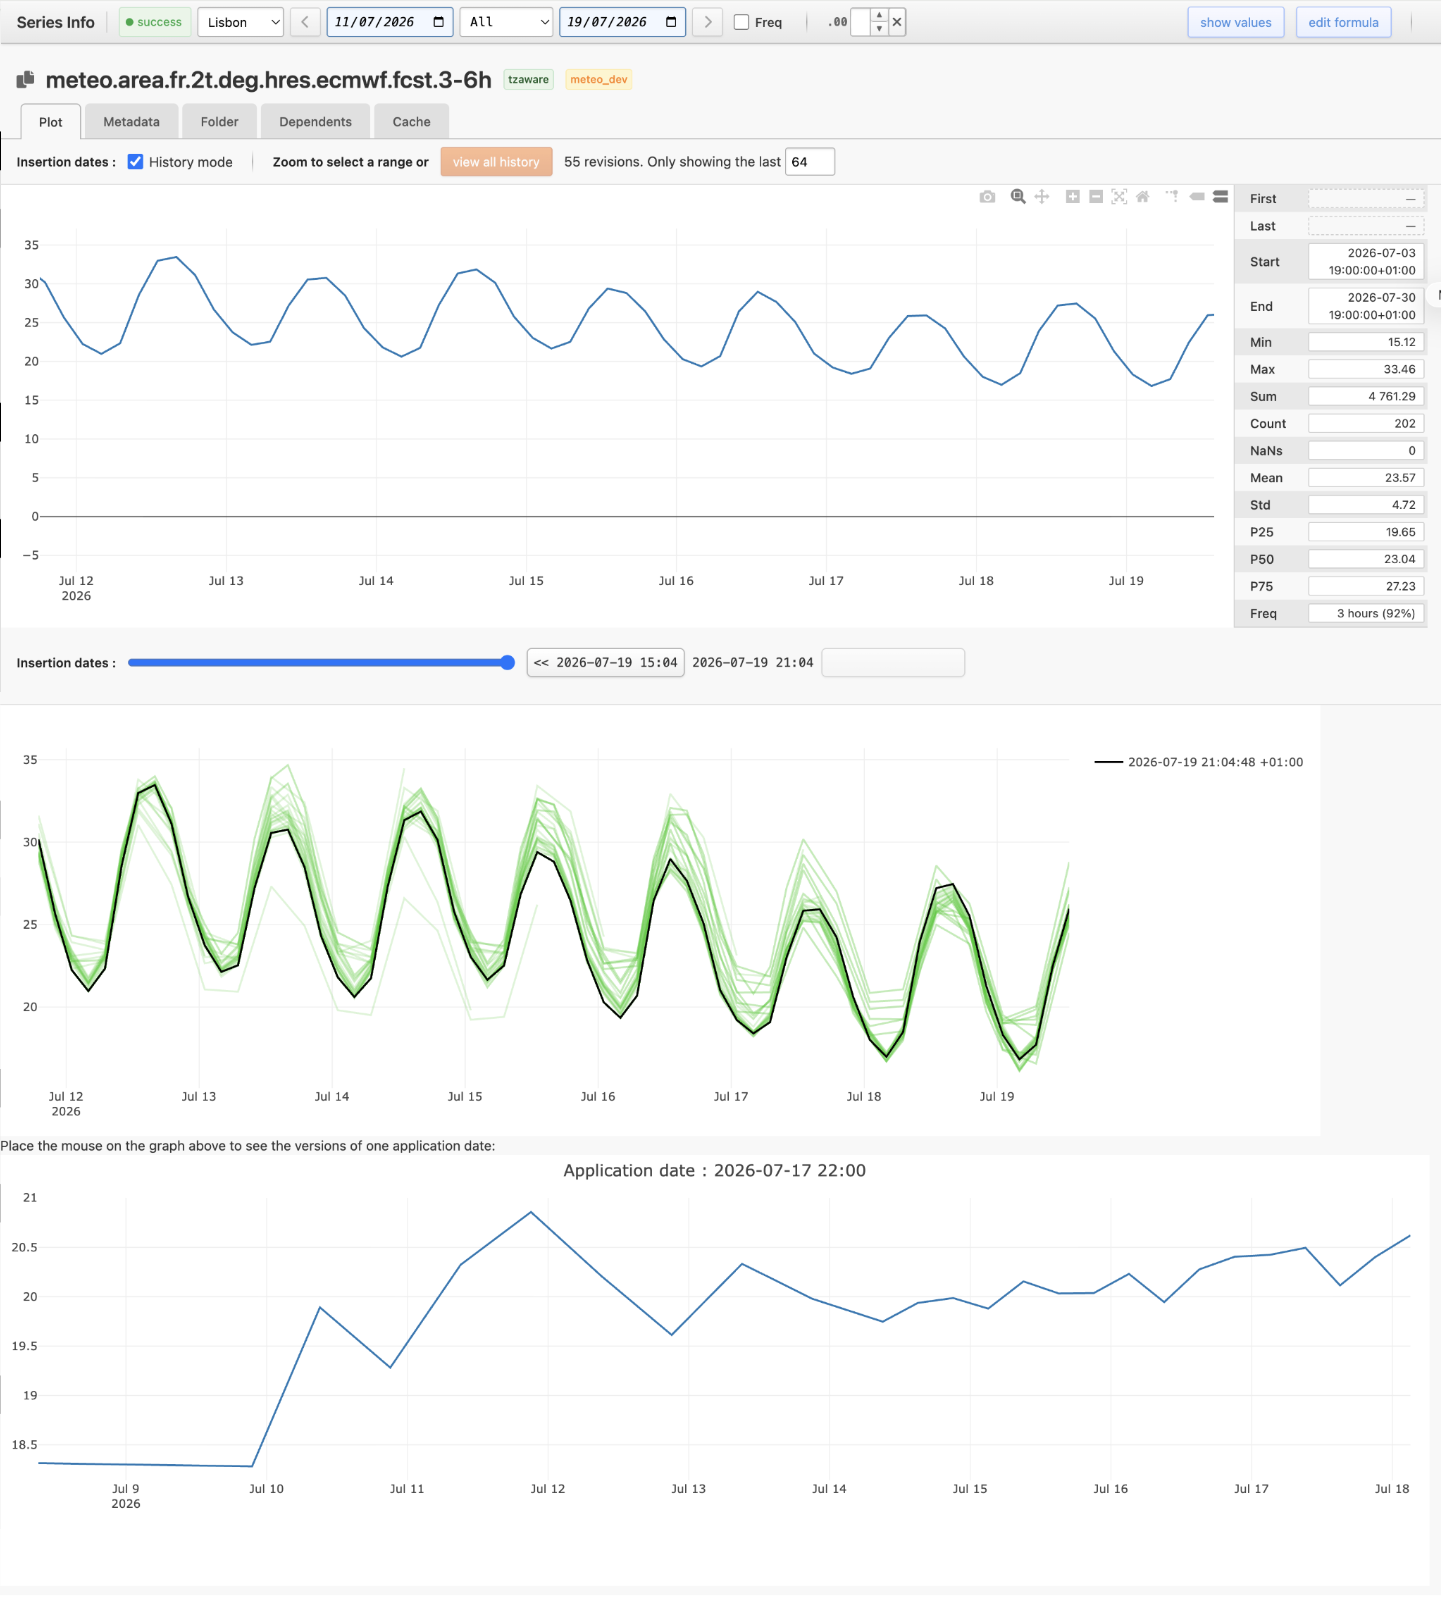
From the info page of a series, you can explore its successive versions by activating the history mode selector, which replays the series across its revisions. A slider (the blue bar) and a view all option let you move through the versions.
The selected version is drawn on the second graph, with its points coloured relative to the version’s date:
green for past values,
red for future values.
Hovering the second graph updates the third graph, which shows how the value at a single timestamp evolved across the revisions.
Working with metadata#
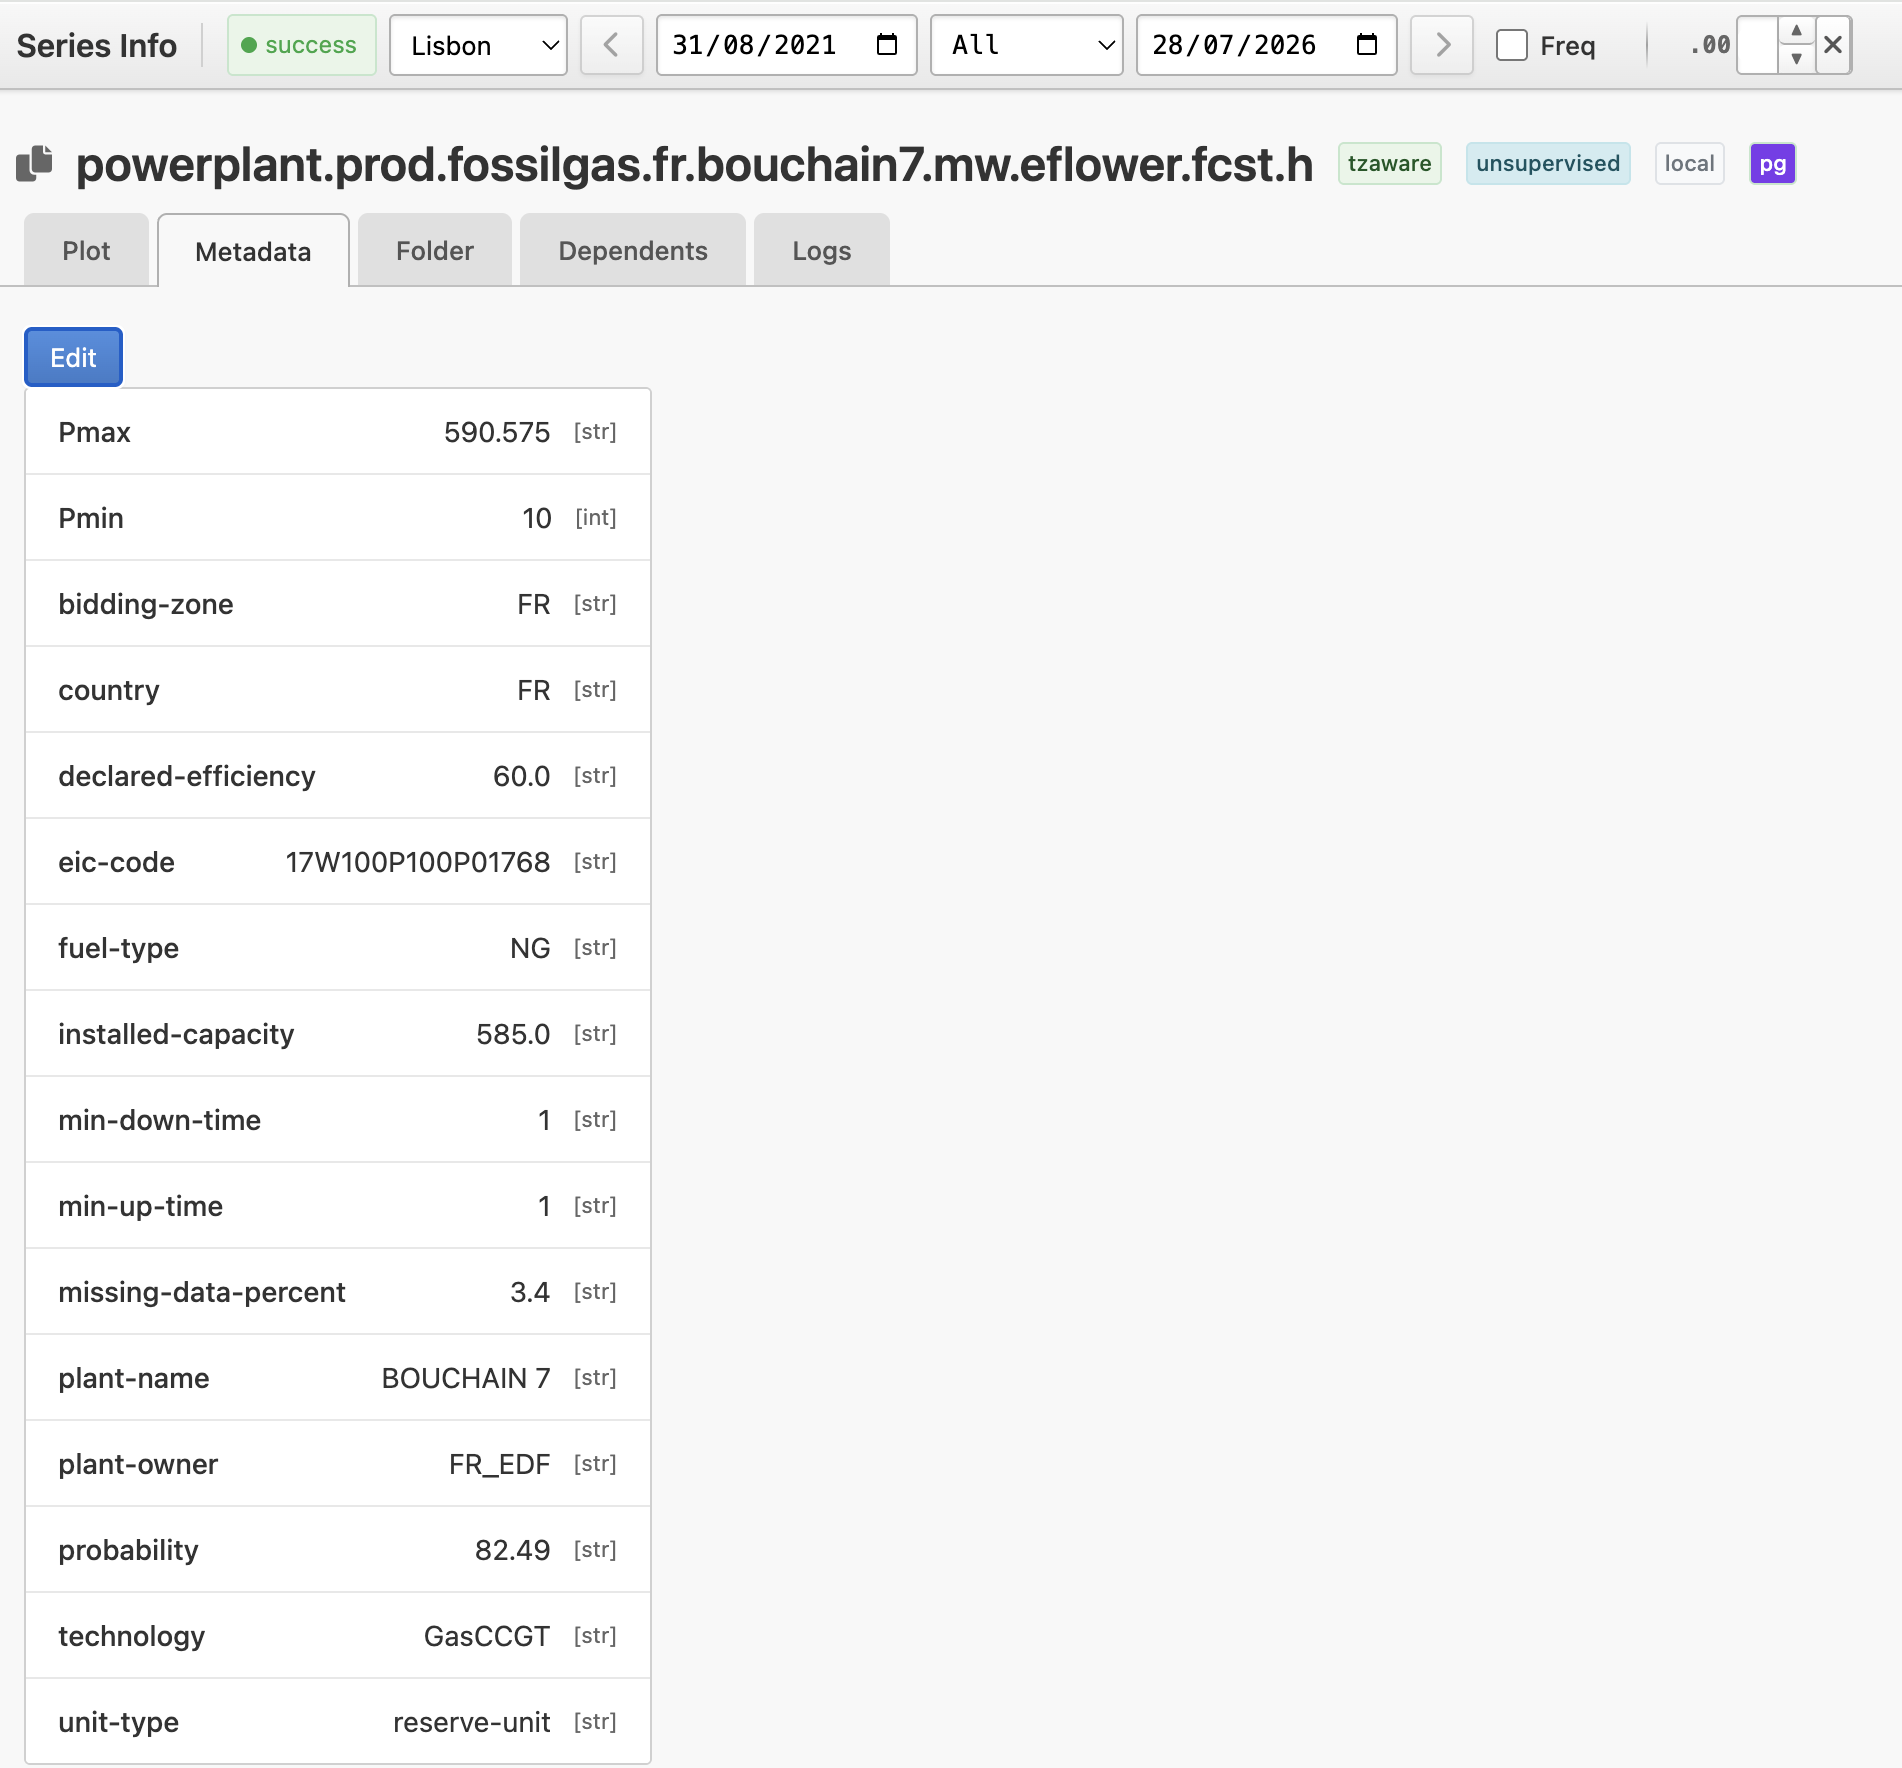
The Metadata tab of the info page shows the series’ user metadata and lets you add or edit it. Metadata is versioned, and you can browse its earlier versions at the bottom of the page.
Renaming a series#
The info page has a Rename button (blue, at the top right), available for local series only. Renaming asks for a confirmation and updates every formula that references the series to the new name.

Deleting a series#
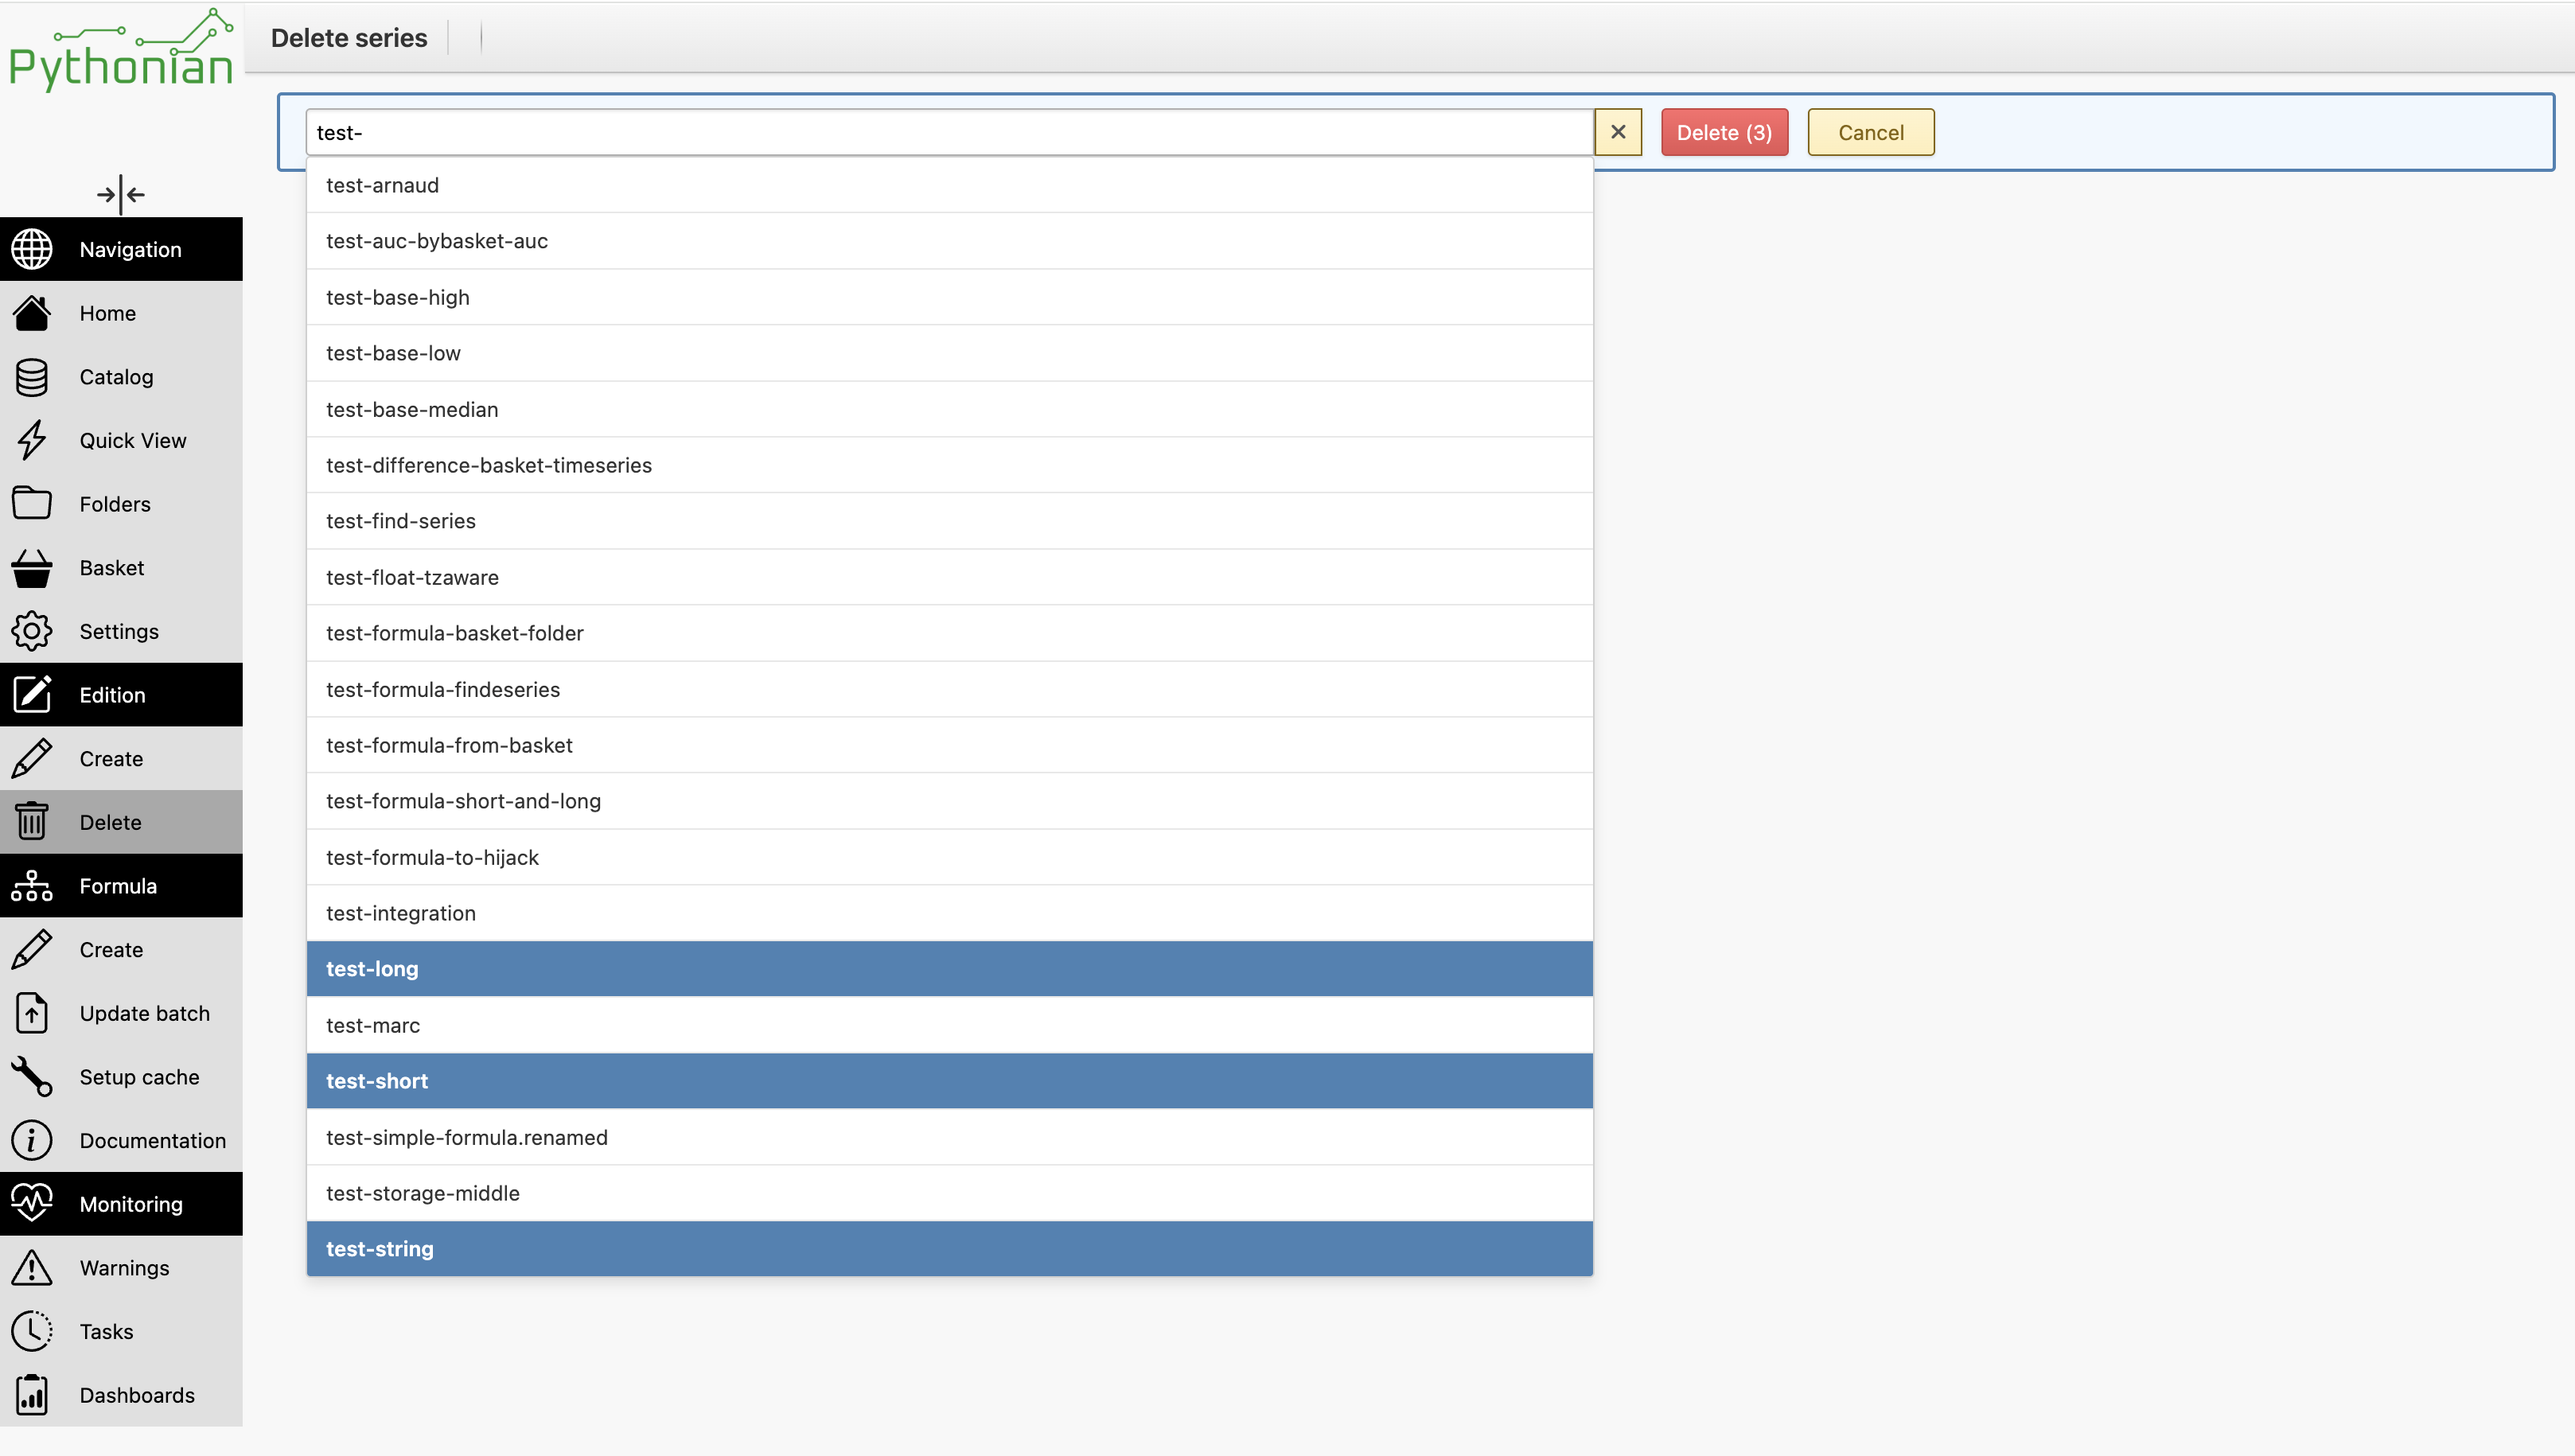
There are two ways to delete a series from the browser: the Delete page (accessible from the left menu) — to remove one or several series at once — and the Delete button on a series’ info page.
A series that is referenced by a formula cannot be deleted: the attempt stops with a message and the series is kept. Remove or repoint the referencing formulas first — you can see the Dependents of a series from the Dependents tab of the info page.
Finding series#
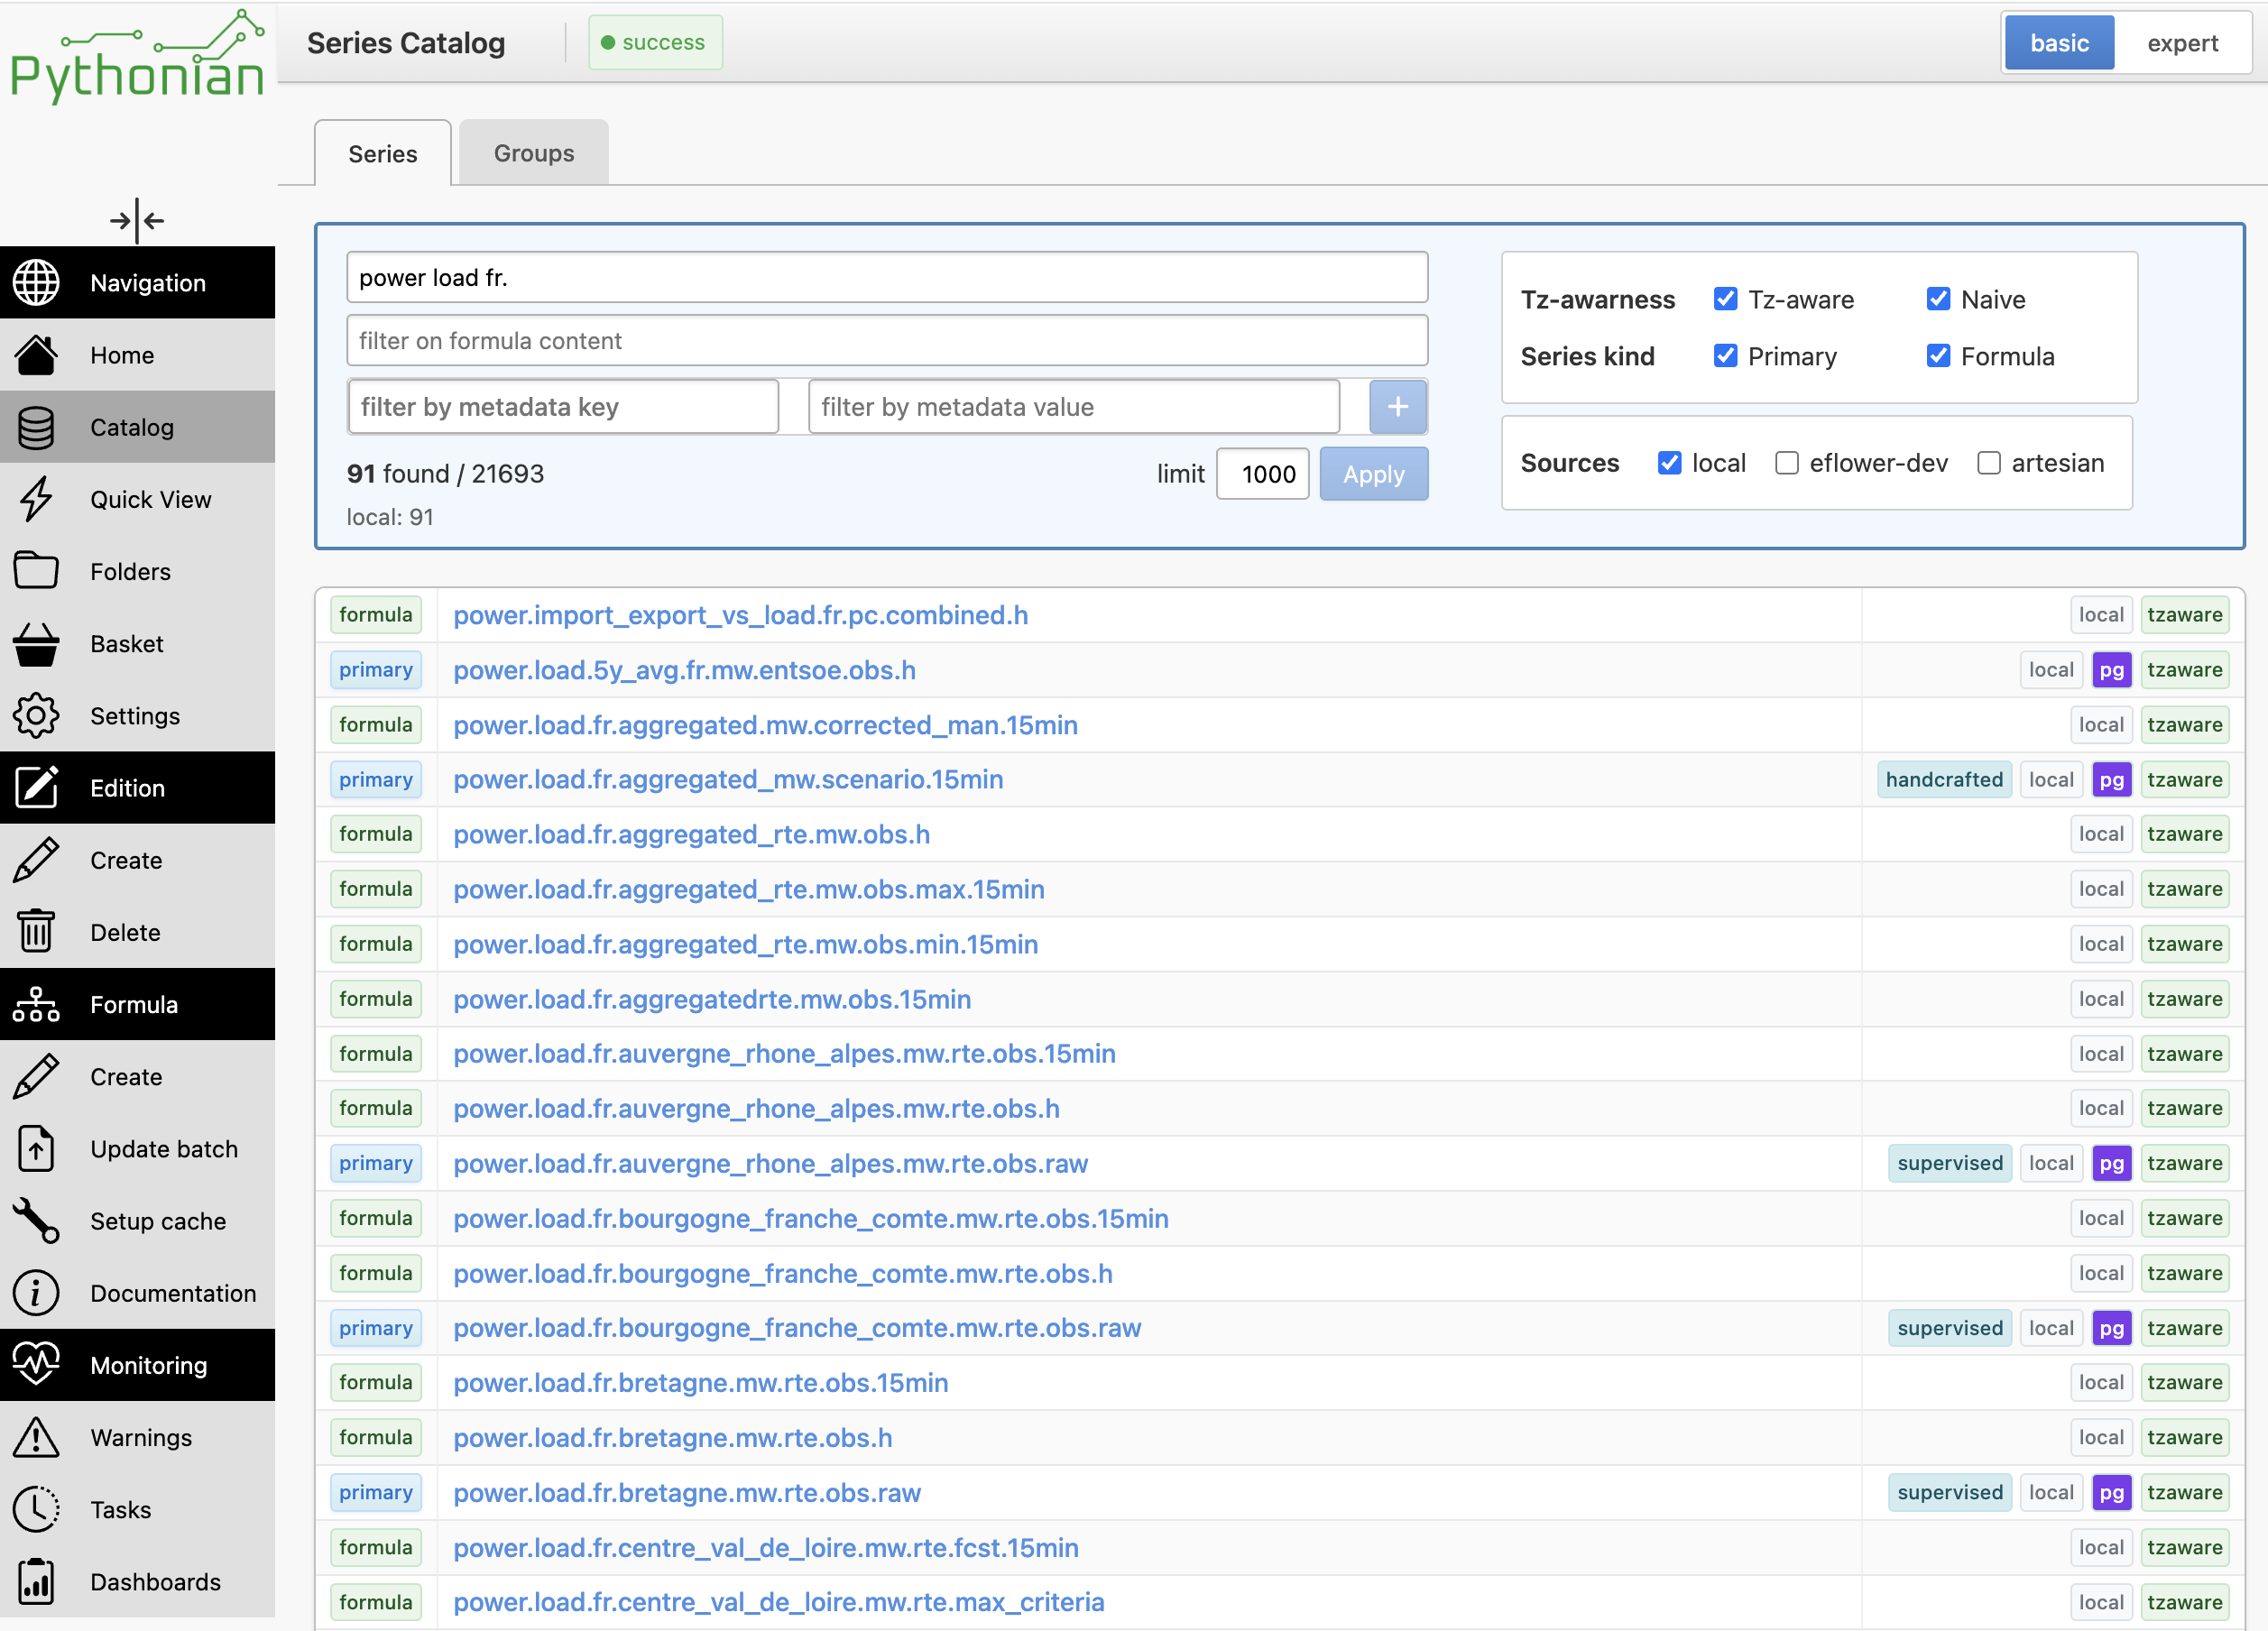
The Catalog lists all series and groups in a flat mode.
A filter panel on the left narrows the list; the filters combine into a single search expression (the same query language as Search Query Language Reference):
Kind — primary series and/or formulas.
Value type — float and/or string series.
Timezone awareness — tzaware or naive series.
Sources — which source, when several are configured.
Name and formula content fragments.
Metadata key/value filters.
Each result row shows the series name (a link to its info page) and a
kind badge, and, on the right, badges for its value type (a string
badge), supervision status, source, storage and timezone-awareness. Hovering
the small M marker of a series that carries metadata opens a popover
listing its metadata. For a local formula the row offers an edit formula
link; for a plain series it shows its left and right value bounds.
Getting series information#
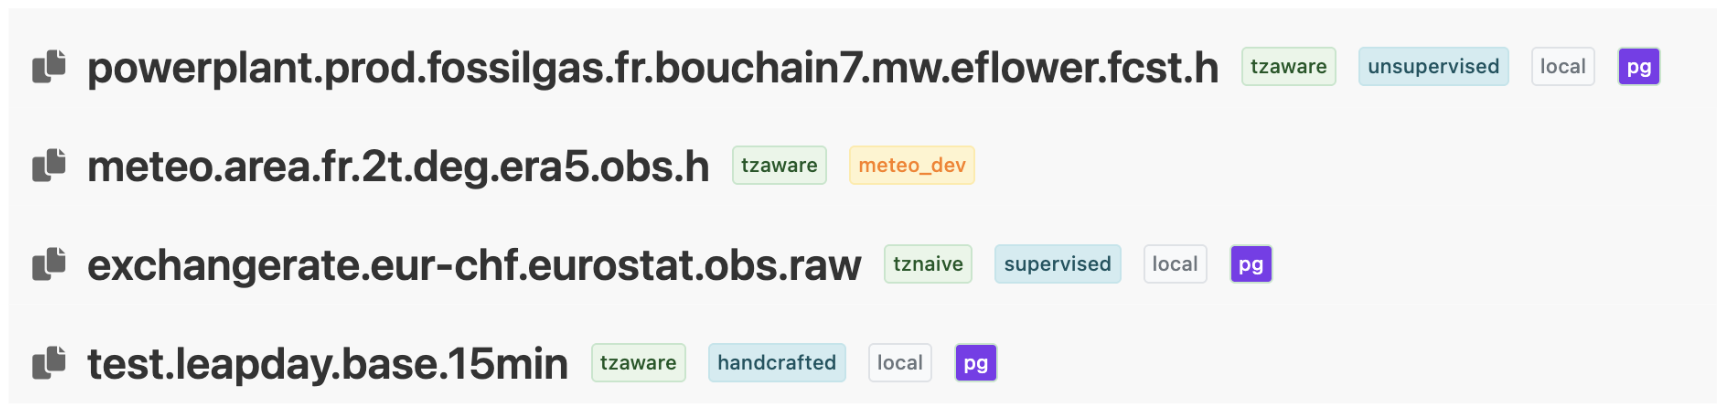
At the top of a series’ info page, a row of badges next to the name summarises it at a glance:
timezone awareness —
tzawareortznaive;supervision status —
unsupervised,supervisedorhandcrafted;source —
local, or the name of the remote source it comes from;storage backend —
pg(PostgreSQL) orfs1.
Working with logs#
The info page’s Logs tab lists the series’ successive revisions, one row per revision:
# — the revision number;
Author — who recorded the revision;
Date — when it was recorded (its insertion date);
Meta — the metadata attached to that revision (for example the request window a scraper recorded).
You type how many revisions you want to see in the Logs displayed field, then click See more logs to load them.
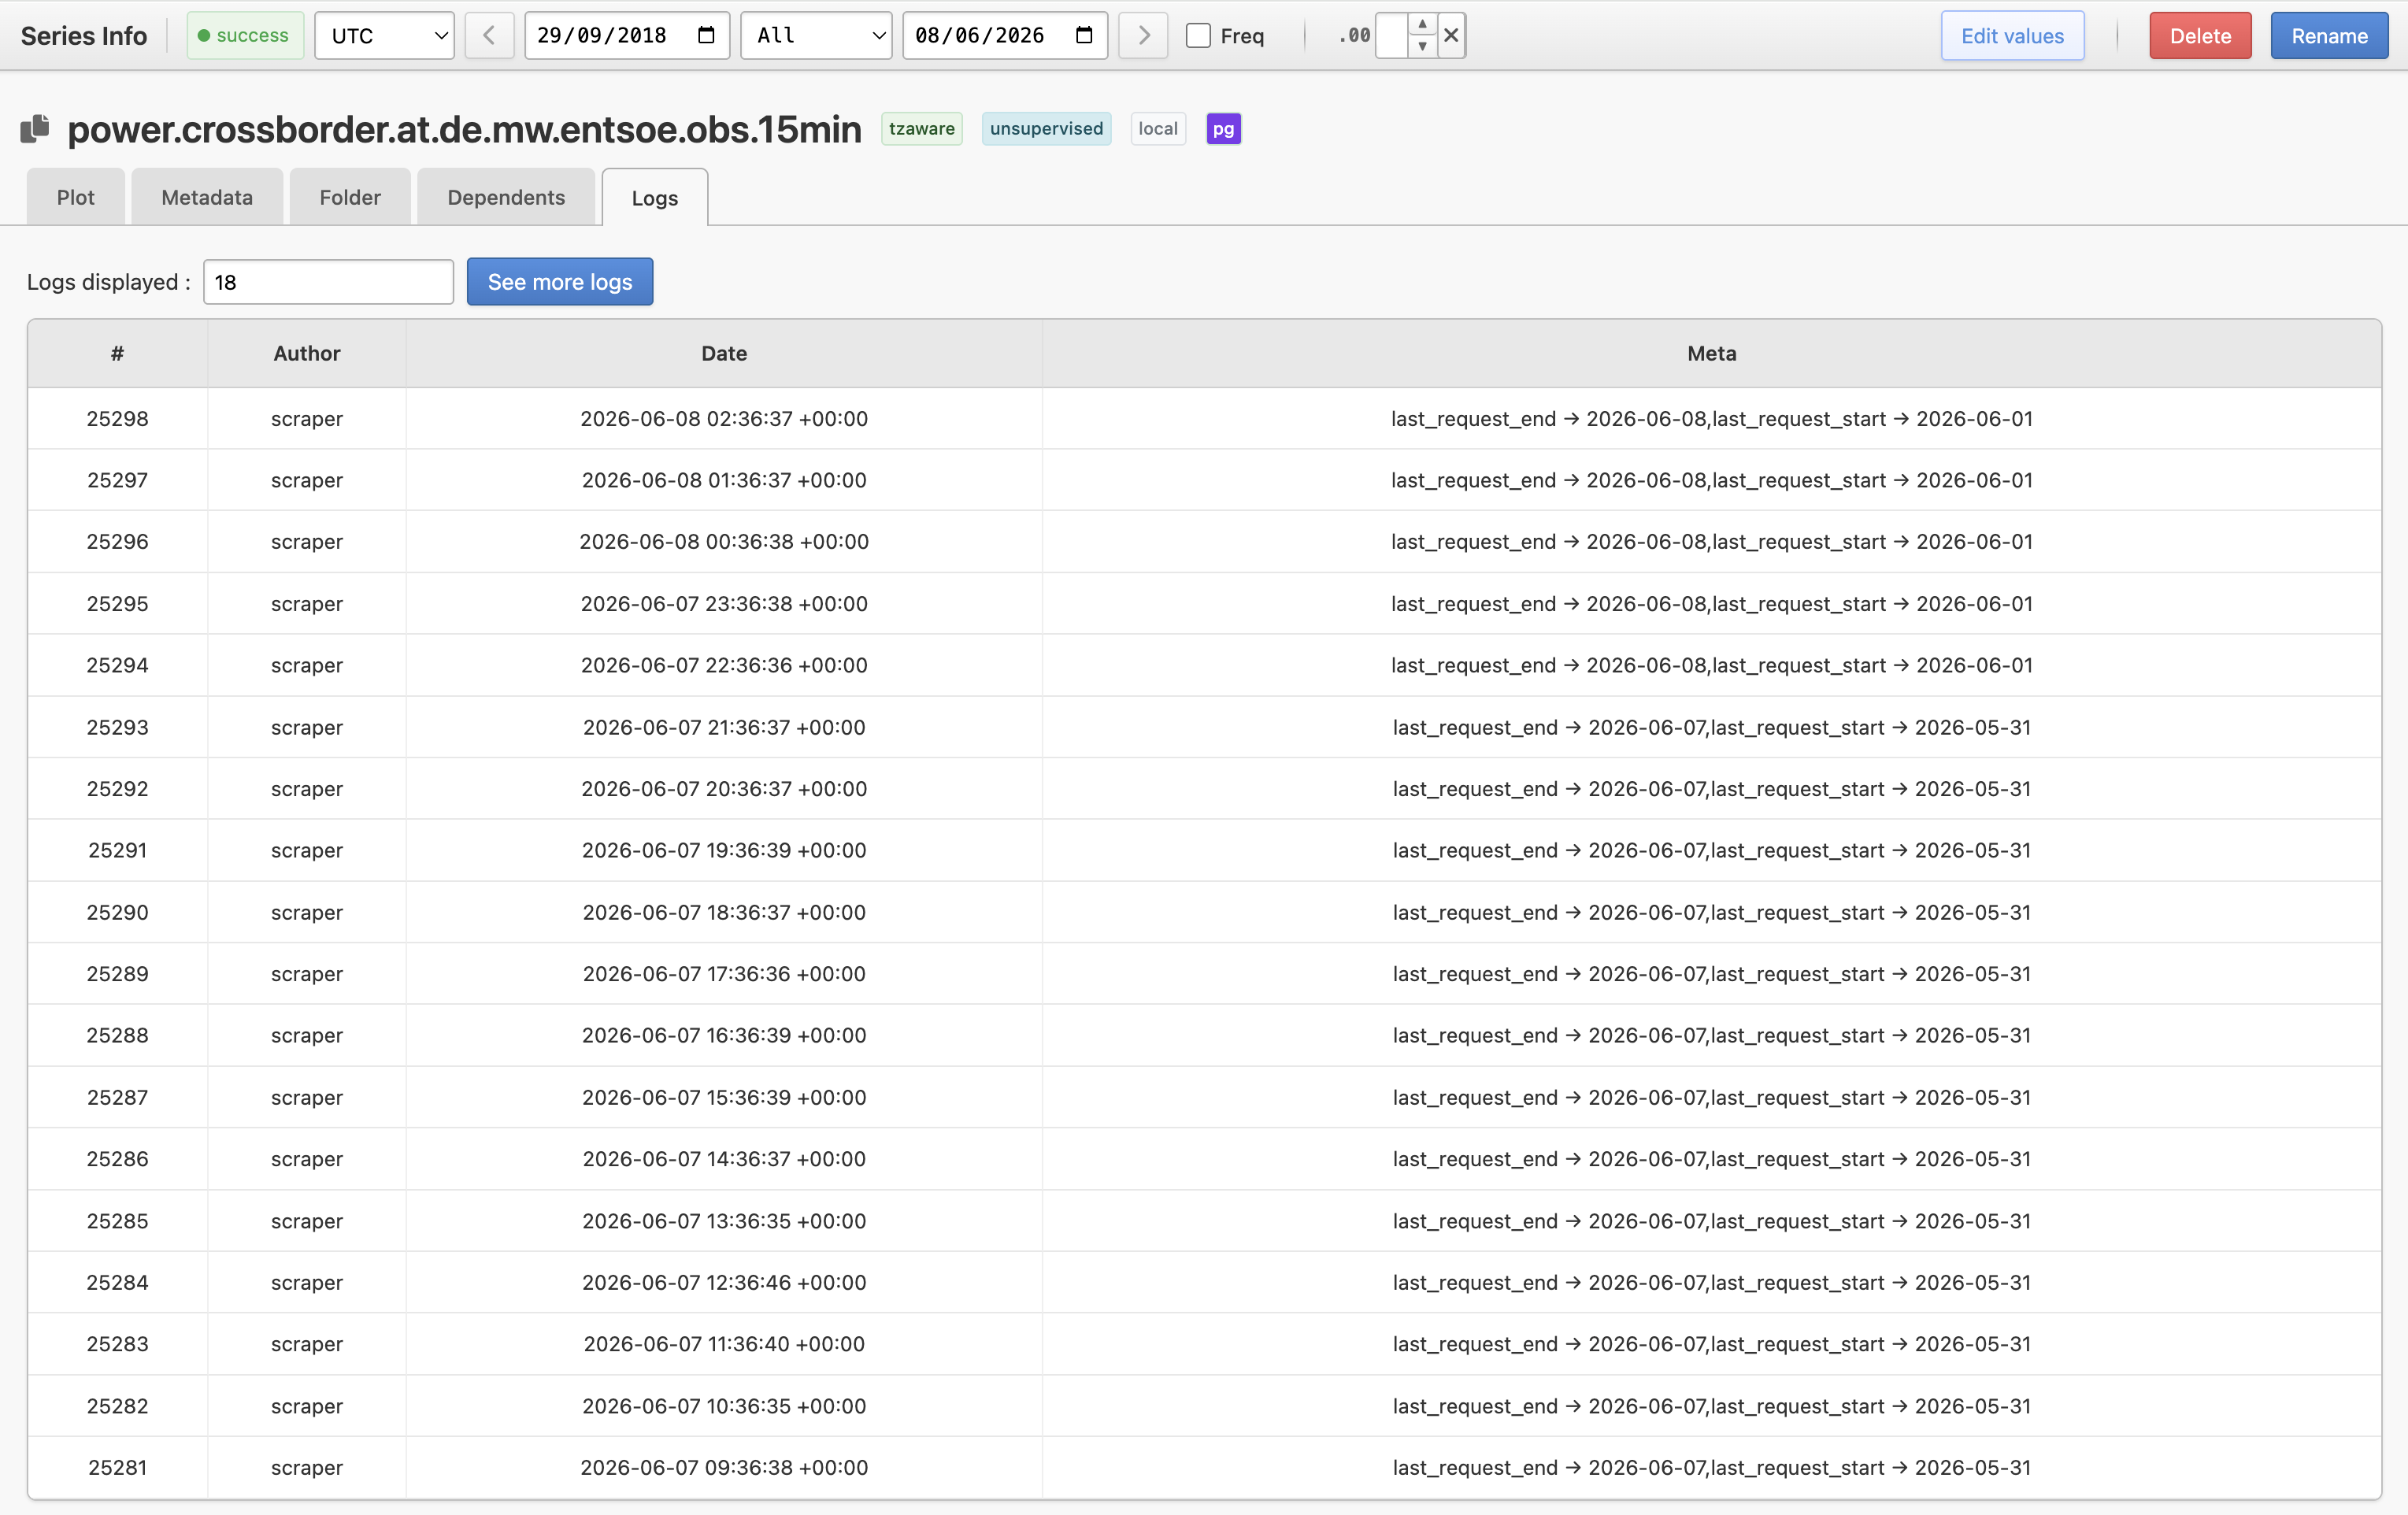
The Logs tab only exists for primary series. Formula series get a Formula cache tab instead, showing their cache state (see Formula cache), and — as soon as the formula has been edited at least once — a Formula history tab listing its successive definitions.
Viewing series#
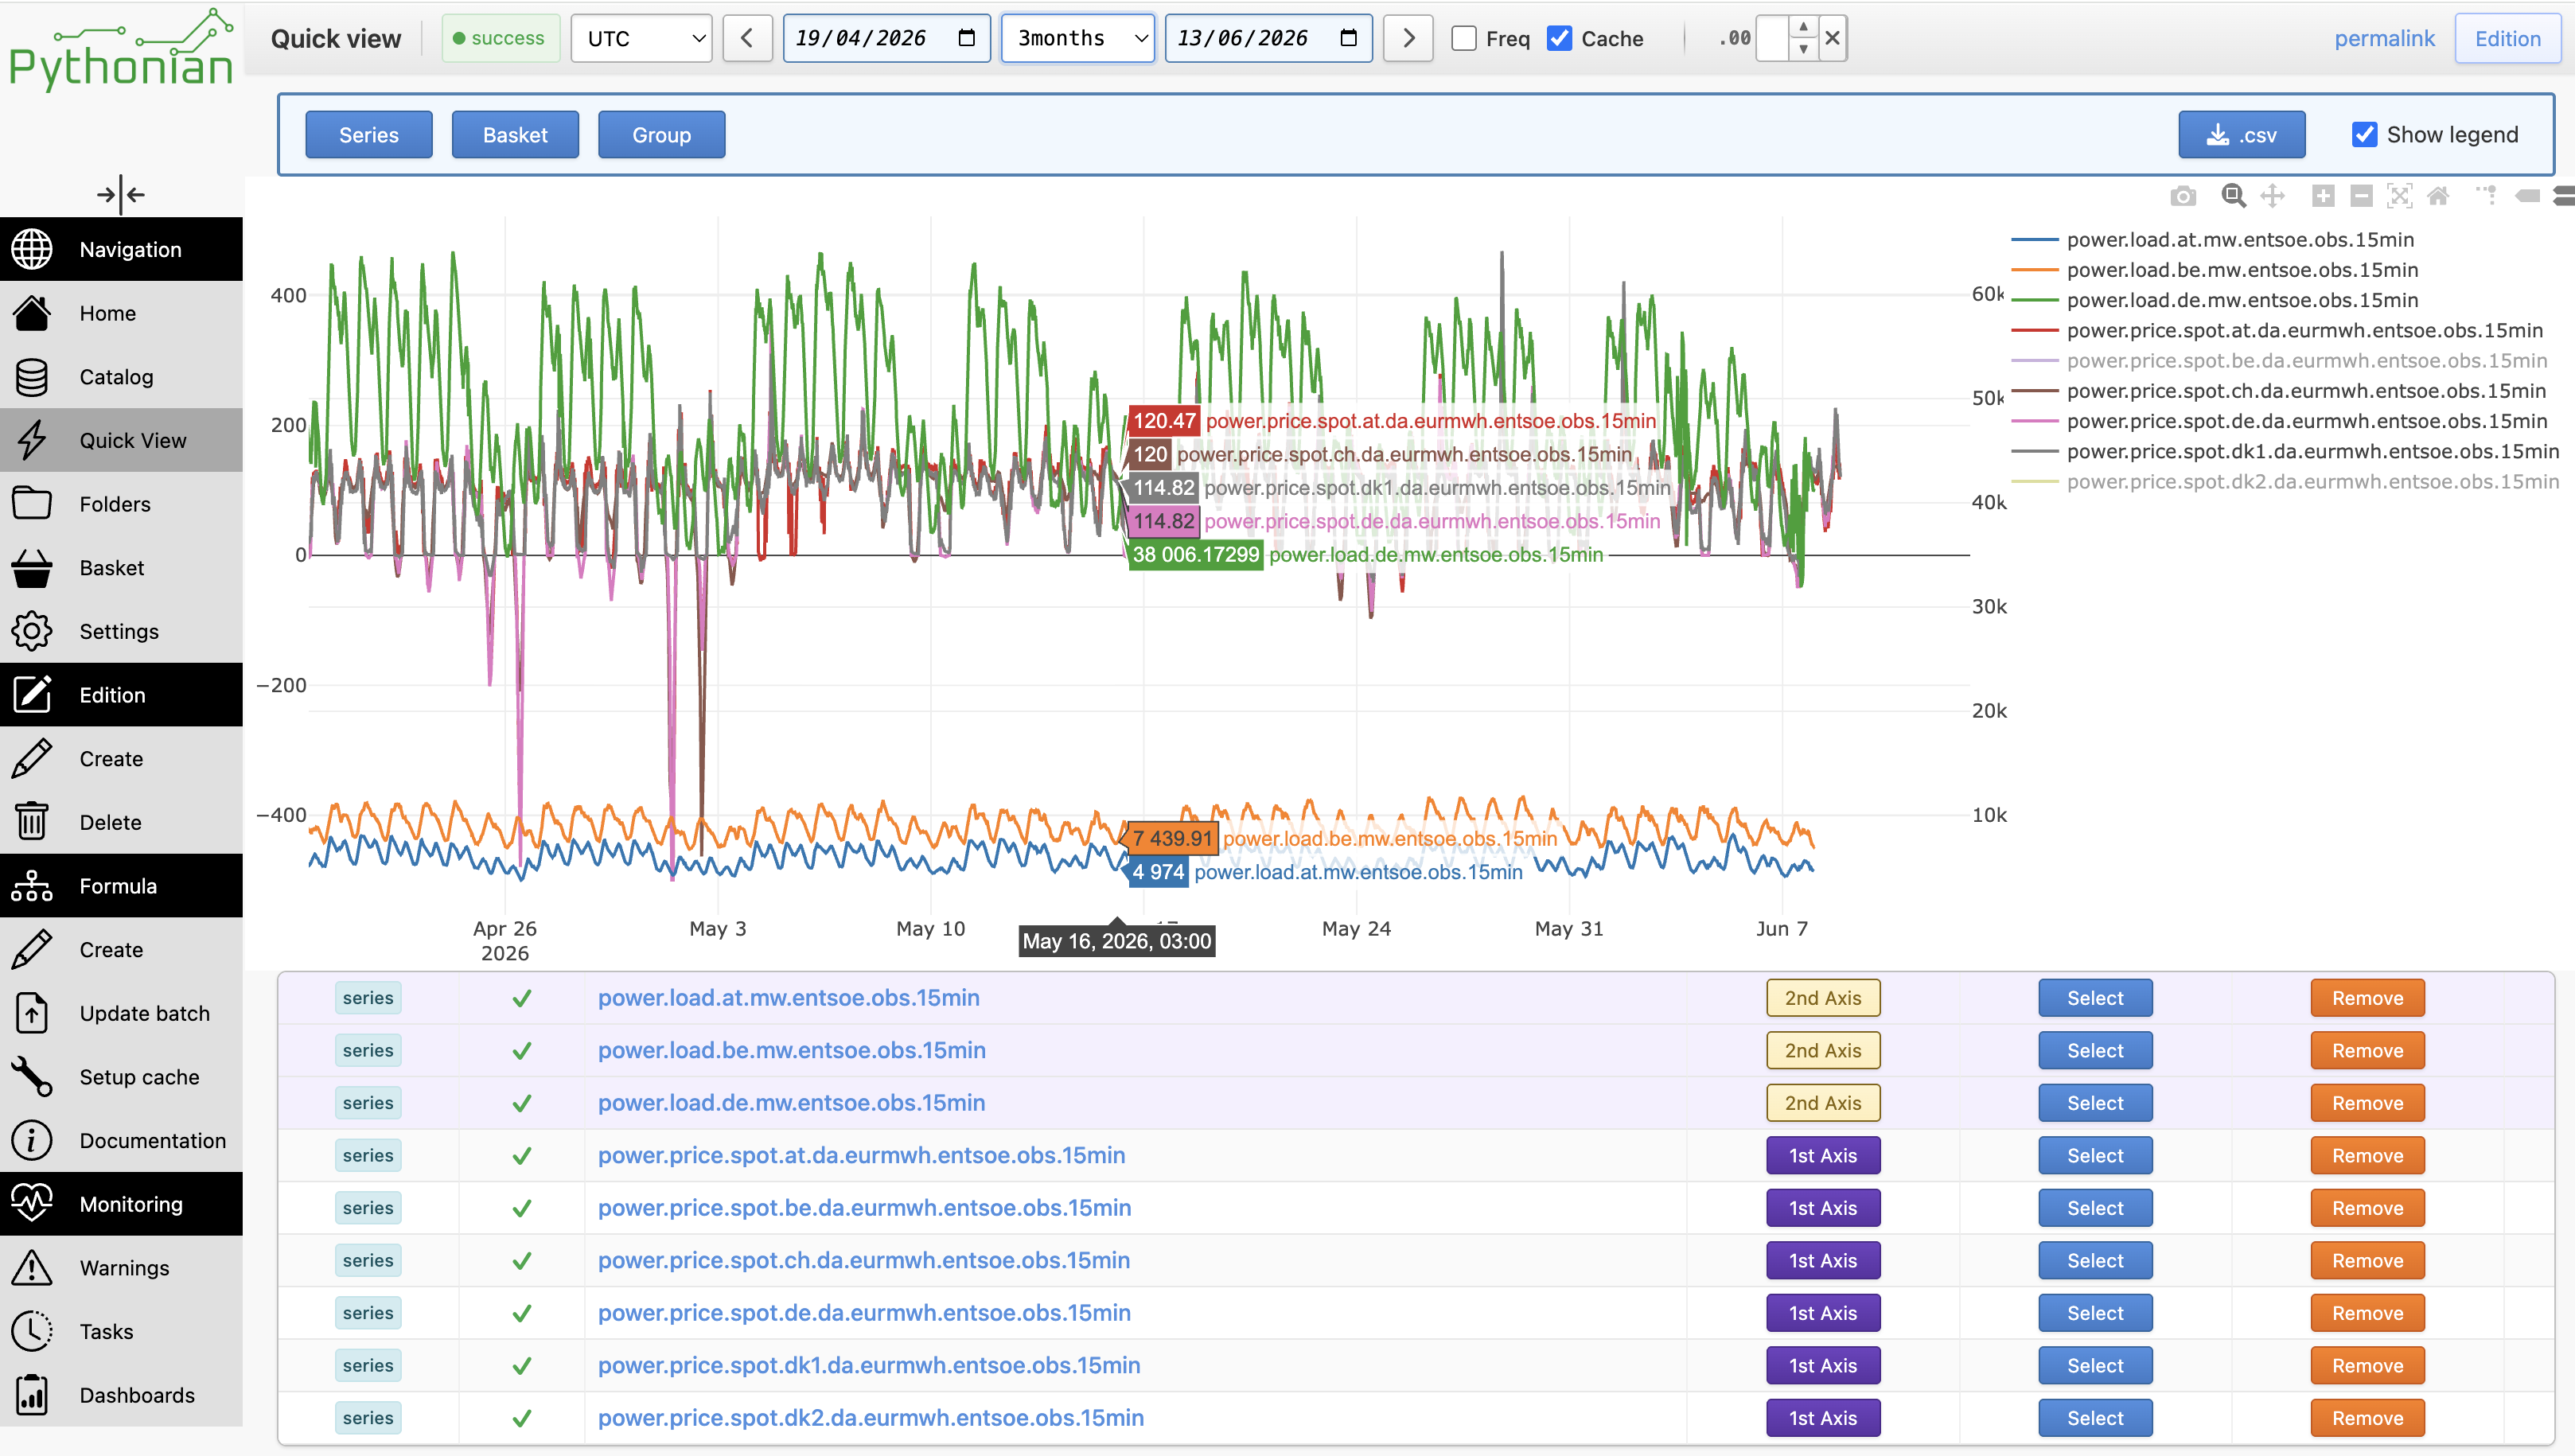
Quick View plots a set of series and groups together on an interactive graph. You reach it from a folder’s View link, from a search query, or from a basket.
Add what to plot with the Series, Basket and Group buttons. Each loaded item then appears in a row below the graph, with its name (a link to its info page), a status marker, an axis toggle to put it on the 1st or 2nd Y axis — handy to mix series of different scales, such as prices and volumes — a Select action to highlight it, and a Remove button to drop it.
The top bar controls the view:
the timezone and the value-date window — a from and a to date, or a named horizon (the horizons of Settings), with arrows to shift it;
a Cache toggle — untick it to force a live re-computation instead of serving cached values;
the number of decimals displayed;
a permalink to share the exact view, and an Edition button that opens the loaded series in the editor.
The graph itself is interactive (zoom, pan, hover tooltips), and Show legend toggles the legend. A .csv button downloads the plotted data — the series and every member of the loaded groups — as a single date-indexed table.